What Determines the Value of the Australian Dollar?
What determines the value of the Australian dollar?
By Anthony Stokes
Lecturer in Economics, Australian Catholic University
"The exchange rate has behaved during 2000 in a way that no-one predicted." Ian
Macfarlane, Governor of the Reserve Bank of Australia, November 2000.
In the light of this statement by Ian Macfarlane and with the obvious importance of the level of the exchange rate to the Australian economy, this paper will examine what is happening to the Australian dollar. The paper will consider what economic theory and models have traditionally said determine the value of the exchange rate and in particular the Australian dollar and what is happening in the current global financial environment.
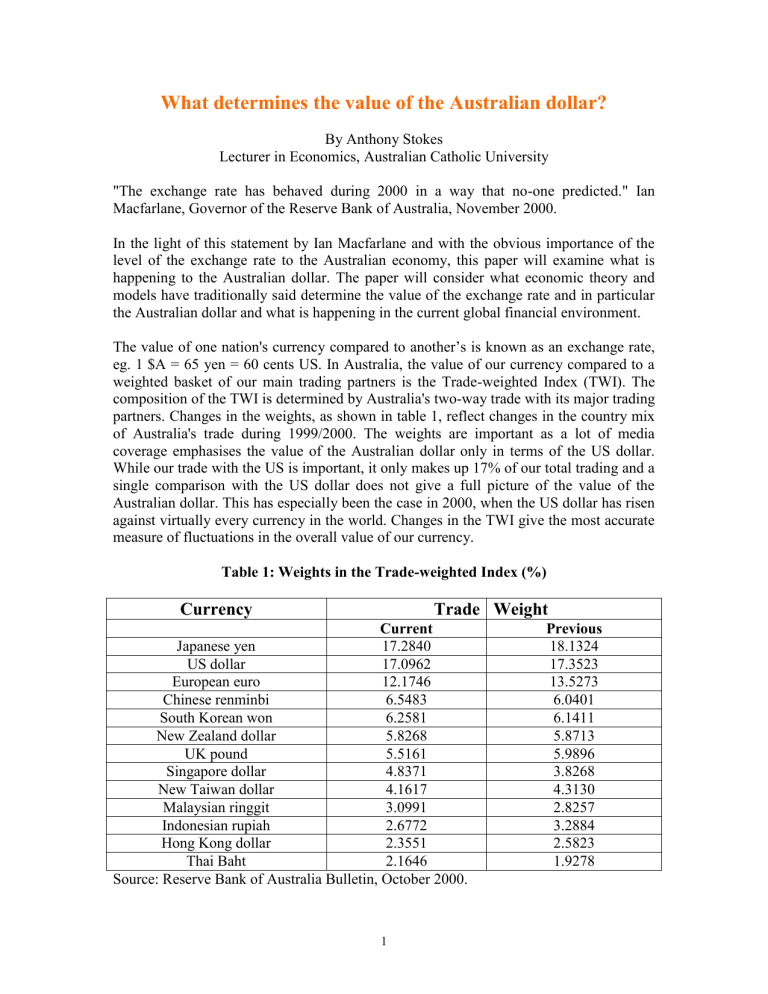
The value of one nation's currency compared to another’s is known as an exchange rate, eg. 1 $A = 65 yen = 60 cents US. In Australia, the value of our currency compared to a weighted basket of our main trading partners is the Trade-weighted Index (TWI). The composition of the TWI is determined by Australia's two-way trade with its major trading partners. Changes in the weights, as shown in table 1, reflect changes in the country mix of Australia's trade during 1999/2000. The weights are important as a lot of media coverage emphasises the value of the Australian dollar only in terms of the US dollar.
While our trade with the US is important, it only makes up 17% of our total trading and a single comparison with the US dollar does not give a full picture of the value of the
Australian dollar. This has especially been the case in 2000, when the US dollar has risen against virtually every currency in the world. Changes in the TWI give the most accurate measure of fluctuations in the overall value of our currency.
Table 1: Weights in the Trade-weighted Index (%)
Currency
Japanese yen
Current
17.2840
Trade Weight
Previous
18.1324
US dollar
European euro
Chinese renminbi
South Korean won
New Zealand dollar
17.0962
12.1746
6.5483
6.2581
5.8268
UK pound
Singapore dollar
New Taiwan dollar
Malaysian ringgit
5.5161
4.8371
4.1617
3.0991
Indonesian rupiah
Hong Kong dollar
2.6772
2.3551
Thai Baht 2.1646
Source: Reserve Bank of Australia Bulletin, October 2000.
17.3523
13.5273
6.0401
6.1411
5.8713
5.9896
3.8268
4.3130
2.8257
3.2884
2.5823
1.9278
1
Note: these are the currencies with a weight of more than 2.0%
The TWI, along with the US dollar, has generally declined for most of 2000, only to show some signs of recovery at the end of the year (see graph 1).
Graph 1 - TWI and US Dollar Movements Against the Australian Dollar
0.7000
0.6500
0.6000
0.5500
0.5000
US$
TWI
58
56
54
52
50
48
46
44
Different countries have different ways that they determine their exchange rate. Buying and selling of currencies takes place in the Foreign Exchange (Forex) Market. The main methods are:
a fixed exchange rate
a flexible or floating exchange rate
a managed exchange rate.
Most developed countries since 1980 have moved towards a flexible or floating exchange rate. Australia has had a floating exchange rate regime since 1983. This exchange rate is determined by market forces ie, the demand for the currency compared to another country’s currency and the supply of that currency. The point, where the quantity demanded at a certain rate equals the quantity supplied at that rate, is the exchange rate
$US
(see graph 2).
Graph 2 - Market determined exchange rate for $A in terms of $US
Price of
$A re
1.20
1.00
.80
.60
.40
.20
S
D
0 1000 2000 3000 4000 5000 6000
2
Quantity of $A re $US (millions)
Graph 2 demonstrates the market for Australian dollars in terms of US dollars
1
. At equilibrium in this market, one Australian dollar is exchanged for sixty US cents. At equilibrium 3000 million Australian dollars are bought and sold.
What determines the demand for the Australian dollar?
If we compare the $A to the $US, the demand for the $A in relation to the $US are individuals or organisations with $US who wish to convert them to $A. These purchasers of $A include:
holders of $US wanting to buy Australian exports
tourists and students coming to Australia wanting $A
holders of $US wanting to transfer income to Australia, eg., foreign investors
Australian businesses in the USA returning profits to Australia and
speculators who think the $A will rise compared to the $US.
Price of
$A re
$US
.40
.20
1.20
1.00
.80
.60
If there is more demand for the $A, the demand curve will shift to the right, from D1 to
D2 and the exchange rate will increase compared to the $US from 60 cents to 80 cents
(graph 3). This increase in a flexible exchange rate is known as an appreciation of the currency. If demand fell the $A would depreciate.
Graph 3
S
0 1000 2000 3000 4000 5000 6000
Quantity of $A re $US (millions)
D1
D2
1 It should be noted that the diagram and explanation that follows refers to the Australian dollar's value as the foreign price of the domestic currency, as is generally taught in schools and referred to in the media.
Economists generally do not use this indirect quote method but discuss an exchange rate as the domestic price of the foreign currency, such as $1.70 Australian for $1 US.
3
What determines the supply of Australian dollars?
If we compare the $A to the $US, the suppliers of the $A in relation to the $US are individuals or organisations with $A who wish to convert them to $US These sellers of the $A include:
holders of $A wanting to buy imports valued in $US
tourists leaving Australia wanting $US
holders of $A wanting to transfer income to USA, eg., foreign investors in the USA, repaying our foreign debt
foreign businesses in Australia returning profits to the USA and
speculators who think the $A will fall compared to the $US.
If there is an increase in the supply of $A to be converted to $US, the supply curve will shift to the right from S1 to S2 (graph 4). The value of the $A will depreciate from 60 cents US to 40 cents US. Any reduction in the supply of $A will lead to an appreciation of the $A.
Graph 4
Price of
$A re
$US
1.20
.40
.20
1.00
.80
.60
0
S1
S2
Quantity of $A re $US (millions)
D
1000 2000 3000 4000 5000 6000
What factors influence the value of the Australian dollar?
There are many factors that influence the value of the Australian dollar compared to other currencies. These include:
Real interest rate differentials - This is the difference between real interest rates between countries. Financial organisations and hedge funds are searching world financial markets to achieve the highest real interest rate return for their investors. A small
4
percentage point change in real interest rates can lead to major movements of international capital funds between nations and currencies.
Relative inflation rates between nations - Higher relative inflation will reduce demand for exports and increase demand for imports, thus lowering the value of the currency.
Commodity Prices and the Terms of Trade - The prices you receive for your exports compared to the prices you pay for imports. Fluctuations in commodity prices and the terms of trade are major factors that have influenced the value of the Australian dollar over its history. Australia is largely a commodity exporting country and traditionally has faced declining terms of trade and thus declining exchange rates over the decades. If the prices improve then the currency rises.
Growth in Real GDP - Domestic growth affects the demand for imports but growth rates in the international economy will influence the level of a nation's exports. The importance of overseas growth was evident in 1998 with the Asian financial crisis reducing demand for Australian exports leading to a blowout in the current account deficit and a fall in the Australian dollar.
The expected future value of the dollar - Expectations are playing an increasing part in determining the level of exchange rates. If funds managers think an exchange rate will rise they will want to purchase that currency. If they think the exchange rates will fall they will sell the currency. The time frame these funds managers will be considering may be years, months, days or only minutes, so this contributes to the growing volatility in international financial markets that has occurred in the last decade.
The Reserve Bank has a model that predicts trends in Australia's exchange rate. The model shows that broad movements in the Australian dollar would normally be explained by changes in Australia's terms of trade (or its close relative commodity prices) and the difference between domestic and foreign interest rates. Based on the model and the basis of previous experience over the period of floating exchange rates, the Reserve Bank expected a rise in the Australian dollar in 2000. Instead there was a fall (see graph 1). The gap between the actual and expected exchange rate was the largest in the past fifteen years.
Economic theory and past experiences pointed to favourable conditions for the Australian dollar. During 2000, there were continued growth in the world economy, an improvement in commodity prices, continued strong growth in the Australian economy, relatively low inflation, a declining current account deficit, a fiscal surplus and rising domestic interest rates. All generally considered as factors that would promote a stronger Australian dollar.
There were some new factors introduced with the terminology of 'old economy' and 'new economy' being introduced in the financial markets. The 'new economy' was seen as being the technology industries and the belief that this was the source of income and wealth in the future. The 'old economy' was seen as traditional industries. Australia was labelled as an 'old economy'. This was not a result of Australia not using new technology, as we were one of the main users per capita in the world, but rather we lacked Australian owned technology industries on our share market. This new emphasis was that funds were going into the shares and industries that were going to give the greatest return.
While this seems like a sound reason for the transfer of funds to the US and the
5
subsequent withdrawal of funds from the Australian economy, economic and financial fundamentals failed to support this. In 2000, as the Australian dollar fell from over 65 cents US to under 51 cents US and recovering to 56 cents US, by the end of the year
(graph 1), the US share index, the Dow Jones Industrial average, lost 6.2% and the hightech Nasdaq index a massive 39%. The Australian All Ordinaries index gained 2.1% in the year. At the same time the Japanese yen was appreciating against the Australian dollar, while the Japanese economy was stagnant and the share index had a substantial decline. If investors were seeking higher returns, funds should have been flowing into the
Australian market from the US and Japanese markets.
Taking all these things into consideration, we can agree with the Governor of the Reserve
Bank, when examining what is causing movements in the Australian dollar, "that something has changed, at least for the present (Macfarlane, 2000)".
What is causing the Australian dollar to fluctuate in the new millenium?
The spread of globalisation especially since 1990 has introduced many new elements into the financial markets and what determines the value of a nation's exchange rate. This does not just apply to Australia, but as we saw in the later half of the 1990's, to many other nations in the world. Firstly, trade in goods and services makes up a much smaller proportion of the demand and supply for currency. In the world economy, payments for international trade only account for about 1% of foreign exchange transactions. The total foreign exchange requirements for exporting and importing of goods and services in
Australia is less than 3% of the total use of the foreign exchange turnover in Australian dollars (Reserve Bank Bulletin, Table F7 and Australian National Accounts, 5206.0). The main purpose for foreign exchange trading is international financial transfers of funds.
Financial flows take many forms. The fastest growing area has involved interest rate, currency, equity and commodity derivatives. Interest rate and currency derivatives make up approximately 98% of the total value of derivatives traded. Derivates are simple financial contracts whose value is linked to or derived from an underlying asset, such as stocks, bonds, commodities, loans and exchange rates. They are international financial instruments for spreading risk or hedging. They include:
futures,
options,
swaps,
forward rate agreements and
other hedging instruments.
More than 50% of the daily foreign exchange turnover against Australian dollars involves swaps and options (Reserve Bank Bulletin, Table F.7). This growth in hedging and shortterm fund transfers has increased exchange rate volatility. The movements in the
Australian dollar in January 2001 aptly demonstrate this. The announcement of a 0.5% interest rate reduction by the US Federal Reserve led to a fall in the Australian dollar by almost 2% within 24 hours. Normally, a fall in interest rates should have increased the
Australian dollar but foreign exchange traders thought that the reduction in interest rates would increase profits in the US, in the future, so would increase the US dollar. Within a
6
further 48 hours the Australian dollar had risen 3 percent. This time the traders argued that the 0.5 percentage point decline might not be sufficient to prevent a recession in the
US economy. This uncertainty and speculation has increased the volatility in the rates and in turn has encouraged further speculation of large profits to be made, in the short-term, from correctly predicting these fluctuations.
The Reserve Bank has highlighted the increasing role of chartist behaviour and market dynamics such as trend-flowing or momentum trading in determining exchange rates
(Reserve Bank Bulletin, November 2000). This relates to traders following the trends or charts of previous movements in exchange rates and economic data to predict what will happen to the exchange rates in the future. This tends to lead to a 'herd' mentality of
'follow the leader' and less reliance on economic fundamentals, as has been demonstrated in recent months.
What caused the movements in the Australian dollar in 2000?
From January 2000 to October 2000, the RBA (Reserve Bank Bulletin, November 2000) pinpointed 15 days on which the exchange rate of the $A moved by a large amount - defined as a move of more than US 0.7 cents (over 1 %). Up till the middle of August, 9 of the 11 changes were a result of news affecting interest rate expectations. The other 2 changes related to fluctuations in share prices and employment data. Rising share prices in the US pushed up the US dollar and worsening US employment data pushed the US dollar down. After the middle of August there were no interest rate changes influencing the currency but rather the rise and fall in the Australian dollar often mirrored that of the
Euro. Currency markets were treating the Euro, the Australian dollar and the New
Zealand dollar as like currencies. While the similarity to the New Zealand economy was not uncommon, the link to the Euro strengthened in 2000. The RBA (Reserve Bank
Bulletin, November 2000) points out that this "close relationship with the Euro has caused widespread puzzlement because, traditionally, the two currencies have not been related and the cyclical positions of the respective economies, as well as their overall structure, do not indicate any reason for such a close relationship." This pattern continued in December and January 2001 with the Australian dollar rising when the euro rose, but by a smaller percentage.
Summarising the fluctuations in the Australian dollar in 2000, it could be concluded that when funds flow into the US then tend to flow out of Australia and the Australian dollar falls. When there is uncertainty in the US markets, investors seek out Australia and other relatively stable economies, and the Australian dollar rises. Interest rate differentials (and future expectations) also continue to play a part in determining the level and direction of the dollar. There is what the Governor of the Reserve Bank (Macfarlane, 2000) refers to as "the intrinsic tendency" for foreign exchange markets to continue to go in one direction, and overshoot the correct level and "to come up with explanations to justify their overshooting". There is also the increasing tendency for volatility as fund managers attempt to maximise profits from frequent changes in the direction and levels of currencies.
7
What role can the Reserve Bank play in this environment?
The RBA currently conducts monetary policy based on the medium term principal of inflationary-targeting. The exchange rate is relevant in terms of this approach. The
Reserve Bank did not make any attempt to push up the Australian dollar in 2000, although it did attempt in the latter part of the year to "support the exchange rate and reinforce the emerging tendency towards stability" (Reserve Bank Bulletin, November
2000) by buying Australian dollars. The RBA bought $500million Australian dollars in
September and a further $100million in October. The RBA is prepared to use foreign exchange intervention if it believes it is facing a 'serious overshoot' in the exchange rate in either direction. The Reserve Bank also indirectly influenced the value of the
Australian dollar in 2000 through its foreign exchange transactions on behalf of the
Commonwealth Government. The Commonwealth Government has a substantial need for foreign exchange each year, mostly to cover payments for defence equipment, embassies and aid. These requirements are arranged by the RBA to ensure that government foreign exchange requirements are not in conflict with the Reserve Bank's policies. Normally these transactions are passed through to the market as they occur. In 1999-2000, the RBA sold $4.9 billion in foreign currencies to the Government and passed $1.6 billion of this through to the market. In the second half of the financial year, when the exchange rate had fallen to low levels none was passed through. This had the effect of reducing pressure on the falling Australian dollar.
It should be noted though that despite this activity the Australian dollar continued to fall in this period. The effectiveness of Reserve Bank intervention is becoming less and less as financial markets expand. While the Reserve Bank can probably be quite effective at pushing the Australian dollar down by selling the currency, it is very limited in pushing it up. The RBA only has its limited foreign reserves to buy the Australian dollar. The value of Australia's foreign reserves fell from $22billion US in December 1999 to $16billion
US in September 2000. The amount of Australian dollars traded in one day in Australia's foreign exchange market exceeds its total foreign reserves. As was seen in the Asian crisis in 1997 in Thailand, running down foreign reserves will not always halt a currency decline. The RBA would have more influence over stopping a currency fall against the
US dollar, if it had the US Federal Reserve operating on its behalf in the foreign exchange market, provided the Fed was prepared to cooperate. The US Federal Reserve is probably the only central bank that can strongly influence the decisions of fund managers.
References
Australian Bureau of Statistics, (2000), Australian National Accounts , 5206.0.
Bryan, D. and Rafferty M. (1999), The Global Economy in Australia , Sydney, Allen and
Unwin.
McTaggart, D., Findlay, C. & M. Parkin (1999), Macroeconomics , Third Edition,
Sydney, Addison-Wesley.
8
Macfarlane, I.F. (2000), 'Recent Influences on the Exchange Rate', Reserve Bank of
Australia Bulletin , December 2000, Sydney, RBA.
Reserve Bank of Australia (2000), Reserve Bank of Australia Bulletin , Various Bulletins,
Sydney, RBA.
Stokes, A.R. (2000), 'The Nature of the Global Economy and Globalisation ’, Economics ,
Vol 36, No 3, October.
Treasury (1999), Implications of the Globalisation of Financial Markets , submission to the House of Representatives Standing Committee on Economics, Finance and Public
Administration: Inquiry into the Implications of the Globalisation of International
Financial Markets for Macroeconomic Policy and the Operation of Financial Markets, available at http://www.aph.gov.au/house/committee/efpa/ifm/subs.htm
9
