pH & Homeostasis Lab
advertisement
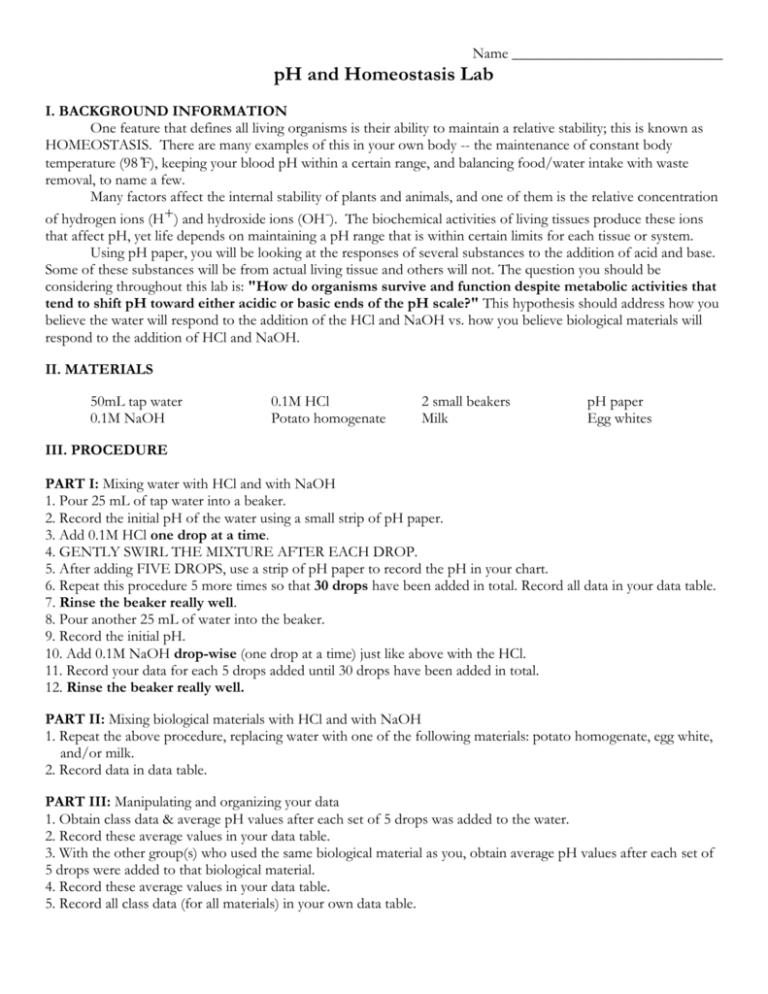
Name ____________________________ pH and Homeostasis Lab I. BACKGROUND INFORMATION One feature that defines all living organisms is their ability to maintain a relative stability; this is known as HOMEOSTASIS. There are many examples of this in your own body -- the maintenance of constant body temperature (98 ̊F), keeping your blood pH within a certain range, and balancing food/water intake with waste removal, to name a few. Many factors affect the internal stability of plants and animals, and one of them is the relative concentration of hydrogen ions (H+) and hydroxide ions (OH-). The biochemical activities of living tissues produce these ions that affect pH, yet life depends on maintaining a pH range that is within certain limits for each tissue or system. Using pH paper, you will be looking at the responses of several substances to the addition of acid and base. Some of these substances will be from actual living tissue and others will not. The question you should be considering throughout this lab is: "How do organisms survive and function despite metabolic activities that tend to shift pH toward either acidic or basic ends of the pH scale?" This hypothesis should address how you believe the water will respond to the addition of the HCl and NaOH vs. how you believe biological materials will respond to the addition of HCl and NaOH. II. MATERIALS 50mL tap water 0.1M NaOH 0.1M HCl Potato homogenate 2 small beakers Milk pH paper Egg whites III. PROCEDURE PART I: Mixing water with HCl and with NaOH 1. Pour 25 mL of tap water into a beaker. 2. Record the initial pH of the water using a small strip of pH paper. 3. Add 0.1M HCl one drop at a time. 4. GENTLY SWIRL THE MIXTURE AFTER EACH DROP. 5. After adding FIVE DROPS, use a strip of pH paper to record the pH in your chart. 6. Repeat this procedure 5 more times so that 30 drops have been added in total. Record all data in your data table. 7. Rinse the beaker really well. 8. Pour another 25 mL of water into the beaker. 9. Record the initial pH. 10. Add 0.1M NaOH drop-wise (one drop at a time) just like above with the HCl. 11. Record your data for each 5 drops added until 30 drops have been added in total. 12. Rinse the beaker really well. PART II: Mixing biological materials with HCl and with NaOH 1. Repeat the above procedure, replacing water with one of the following materials: potato homogenate, egg white, and/or milk. 2. Record data in data table. PART III: Manipulating and organizing your data 1. Obtain class data & average pH values after each set of 5 drops was added to the water. 2. Record these average values in your data table. 3. With the other group(s) who used the same biological material as you, obtain average pH values after each set of 5 drops were added to that biological material. 4. Record these average values in your data table. 5. Record all class data (for all materials) in your own data table. IV. DATA/OBSERVATIONS Title: __________________________________________________ Drops Added Group pH Acid + Water Class pH Acid + Water Group pH Acid +Potato Class pH Acid + Potato Group pH Acid + Egg Class pH Acid + Egg Group pH Acid +Milk Class pH Acid +Milk Group pH Base +Milk Class pH Base +Milk 0 5 10 15 20 25 30 Title: __________________________________________________ Drops Added Group pH Base + Water Class pH Base + Water Group pH Base +Potato Class pH Base + Potato Group pH Base + Egg Class pH Base + Egg 0 5 10 15 20 25 30 Create a graph of your class average data showing the addition of acid to each of the liquids (water, potato, egg white, milk) and the addition of base to each of the liquids. You will decide whether a line graph or a bar graph is appropriate for your data. Title ____________________________________________ Use the graph that you made to briefly summarize the effects of HCl and NaOH on the tap water and biological materials. ** Note: Because you are still in the results section, all comments here must be OBSERVATIONAL, not analytical. Use these questions to help GUIDE your summary: What happens to the pH as base or acid is added? Does the pH level off after a while? Compare the pH changes you observed in the tap water with the pH changes you saw overall in the biological materials (the potato, egg white, and milk) - do you notice any difference? V.ANALYSIS/DISCUSSION Answer the following questions. 1. Based on what you can see from your data, does your data support your hypothesis? Why or why not? 2. Relate your findings to the theme of homeostasis, and comment upon the question posed at the beginning of this lab - how do you think that organisms survive and function despite an organism’s activities that tend to shift pH toward the acidic or basic ends of the pH scale? 3. Describe homeostasis in your own words. Also discuss how buffers work and that might relate to your data. VI. SOURCES OF ERROR Discuss 3 sources of error and how they could have affected your results. Then give recommendations for fixing these sources of error. 1. 2. 3.
