TABLE OF CONTENTS Chapter 3 USING NUMBERS TO
advertisement
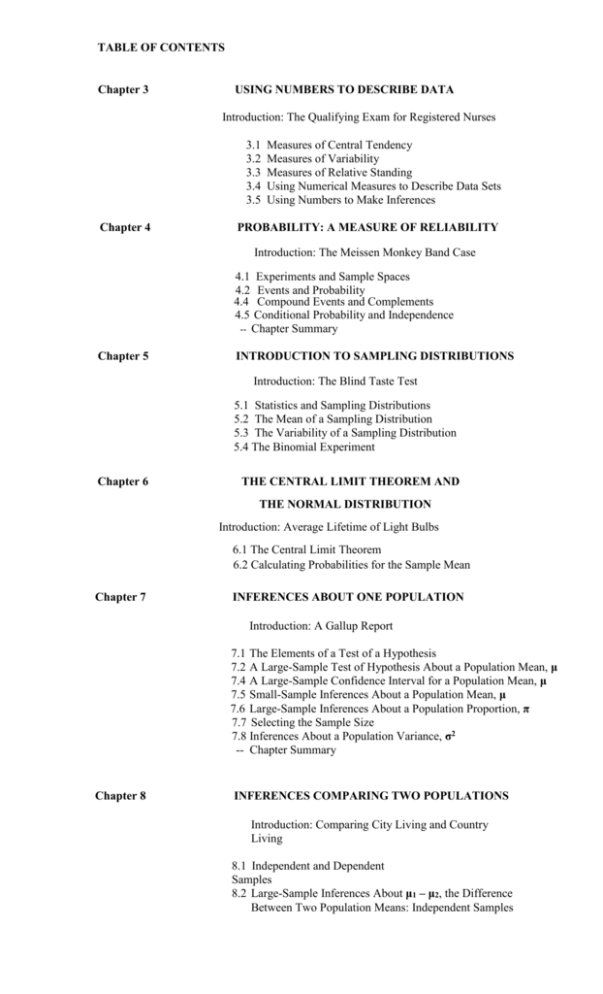
TABLE OF CONTENTS Chapter 3 USING NUMBERS TO DESCRIBE DATA Introduction: The Qualifying Exam for Registered Nurses 3.1 3.2 3.3 3.4 3.5 Chapter 4 Measures of Central Tendency Measures of Variability Measures of Relative Standing Using Numerical Measures to Describe Data Sets Using Numbers to Make Inferences PROBABILITY: A MEASURE OF RELIABILITY Introduction: The Meissen Monkey Band Case 4.1 4.2 4.4 4.5 Experiments and Sample Spaces Events and Probability Compound Events and Complements Conditional Probability and Independence -- Chapter Summary Chapter 5 INTRODUCTION TO SAMPLING DISTRIBUTIONS Introduction: The Blind Taste Test 5.1 Statistics and Sampling Distributions 5.2 The Mean of a Sampling Distribution 5.3 The Variability of a Sampling Distribution 5.4 The Binomial Experiment Chapter 6 THE CENTRAL LIMIT THEOREM AND THE NORMAL DISTRIBUTION Introduction: Average Lifetime of Light Bulbs 6.1 The Central Limit Theorem 6.2 Calculating Probabilities for the Sample Mean Chapter 7 INFERENCES ABOUT ONE POPULATION Introduction: A Gallup Report 7.1 The Elements of a Test of a Hypothesis 7.2 A Large-Sample Test of Hypothesis About a Population Mean, μ 7.4 A Large-Sample Confidence Interval for a Population Mean, μ 7.5 Small-Sample Inferences About a Population Mean, μ 7.6 Large-Sample Inferences About a Population Proportion, π 7.7 Selecting the Sample Size 7.8 Inferences About a Population Variance, σ2 -- Chapter Summary Chapter 8 INFERENCES COMPARING TWO POPULATIONS Introduction: Comparing City Living and Country Living 8.1 Independent and Dependent Samples 8.2 Large-Sample Inferences About μ1 – μ2, the Difference Between Two Population Means: Independent Samples 8.3 Small-Sample Inferences About μ1 – μ2, the Difference Between Two Population Means: Independent Samples 8.4 Inferences About μ1 – μ2, the Difference Between Two Population Means: Dependent Samples 8.5 Large-Sample Inferences About π1 – π2, the Difference Between Two Population Proportions: Independent Samples 8.6 Selecting the Sample Sizes 8.7 Comparing Two Population Variances σ12 and σ22: Independent Samples -- Chapter Summary Chapt er 9 LEAST SQUARES: A STRAIGHT-LINE RELATIONSHIP Introduction: Analyzing Crime Rates 9.1 Exploratory Data Analysis: The Scatterplot The Equation of a Straight Line Fitting the Model: The Method of Least Squares TABLES Table II – The Normal Distribution Table III – z-values for Rejection Regions for Large-Sample Hypothesis Tests Table IV – z- values for Large-Sample Confidence Intervals Table V – t-values for Rejection Regions for Small-Sample Hypothesis Tests Table VI – t-values for Confidence Intervals Table VII A. – χ2 – values for Rejection Regions : One-Tailed Tests Table VII B. - χ2 - values for Rejection Regions : Two-Tailed Tests Table VIII - χ2 – values for Confidence Intervals Table IX – Percentage Points of the F-Distribution: α = .10 Table X – Percentage Points of the F-Distribution: α = .05 Table XI – Percentage Points of the F-Distribution: α = .025 Table XII – Percentage Points of the F-Distribution: α = .01 Answers To Selected Exercises Appendix – Counting Methods Binomial Distribution Worked Examples
