Name
advertisement
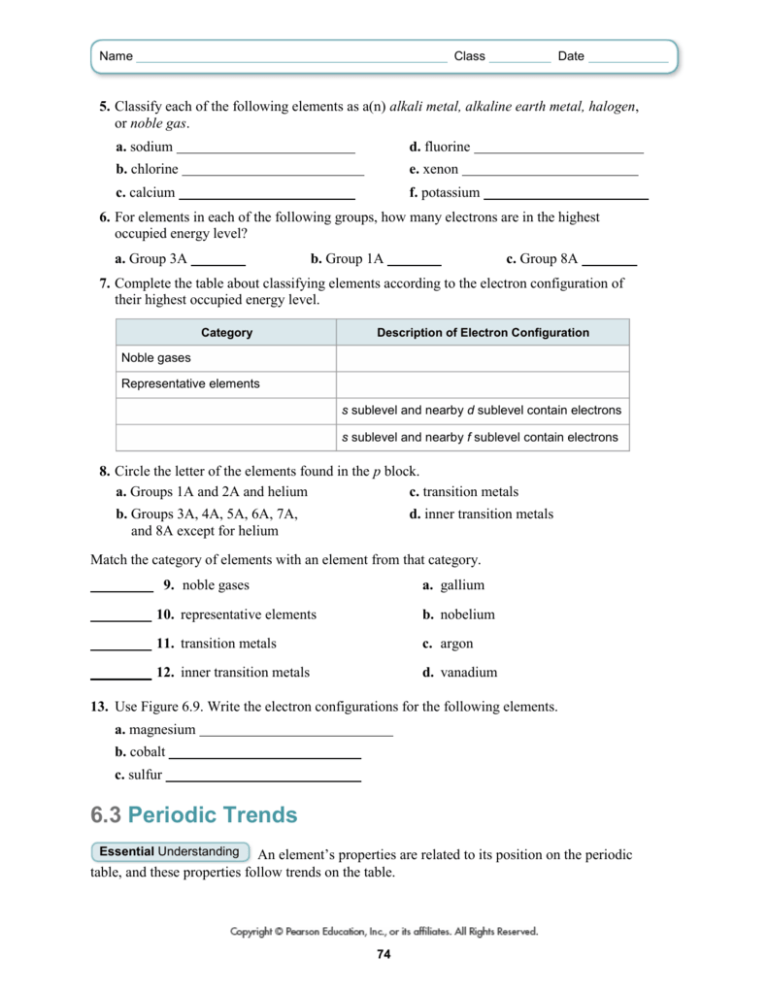
Name Class Date 5. Classify each of the following elements as a(n) alkali metal, alkaline earth metal, halogen, or noble gas. a. sodium d. fluorine b. chlorine e. xenon c. calcium f. potassium 6. For elements in each of the following groups, how many electrons are in the highest occupied energy level? a. Group 3A b. Group 1A c. Group 8A 7. Complete the table about classifying elements according to the electron configuration of their highest occupied energy level. Category Description of Electron Configuration Noble gases Representative elements s sublevel and nearby d sublevel contain electrons s sublevel and nearby f sublevel contain electrons 8. Circle the letter of the elements found in the p block. a. Groups 1A and 2A and helium c. transition metals b. Groups 3A, 4A, 5A, 6A, 7A, and 8A except for helium d. inner transition metals Match the category of elements with an element from that category. 9. noble gases a. gallium 10. representative elements b. nobelium 11. transition metals c. argon 12. inner transition metals d. vanadium 13. Use Figure 6.9. Write the electron configurations for the following elements. a. magnesium b. cobalt c. sulfur 6.3 Periodic Trends An element’s properties are related to its position on the periodic table, and these properties follow trends on the table. Essential Understanding 74 Name Class Date Lesson Summary Trends in Atomic Size Atomic size is an atom’s atomic radius, or one-half the distance between two like atoms when they are joined together. Atomic size generally increases from top to bottom within a group because the number of energy levels increases. Atomic size decreases from left to right across a period because electrons are added to the same energy level and are pulled closer to the nucleus by increasing numbers of protons. Ions Ions form when atoms gain or lose electrons. A positively charged cation forms when an atom loses one or more electrons. A negatively charged anion forms when an atom gains one or more electrons. Trends in Ionization Energy Ionization energy is a measure of how much energy is required to remove an electron from an atom. First ionization energy is the amount of energy required to remove one electron from a neutral atom. Ionization energy tends to decrease from top to bottom within a group and increase from left to right across a period. Trends in Ionic Size Trends in ionic size are based on the fact that metals tend to lose electrons, and nonmetals tend to gain electrons. A cation is smaller than the atom that formed it; an anion is larger than the atom that formed it. Ionic size generally increases from top to bottom within a group and decreases from left to right across a period. Trends in Electronegativity Electronegativity is a measure of an atom’s ability to attract an electron when the atom is bonded to another atom. The trends in electronegativity are similar to the trends in ionization energy. Electronegativity tends to decrease from top to bottom within a group and to increase from left to right across a period. BUILD Math Skills Reading a Graph A graph is a visual way to interpret or understand data. A graph shows relationships that exist among the data. The title of the graph tells you what information the graph shows. The x-axis is the horizontal axis and the y-axis is the vertical axis. Examine each axis to find what each one represents and what units are used. The two main types of graphs are bar graphs and line graphs. Turn the page to learn more about reading a graph. 75 Name Class Date A bar graph has bars that run horizontally or vertically. To obtain data for a horizontal bar graph, you will need to match the end of the bar to the information on the horizontal axis at the bottom. The title of the vertical axis tells what the bar represents. To obtain data for a vertical bar graph, compare the end of the bar to the information on the vertical axis to the side. The title of the vertical axis tells what the bar represents. The graphs above provide the same information, but in two different ways. Look at the horizontal bar graph for the year 1999. Follow the end of the bar to the bottom axis and you will see that Company X made a profit of $30,000. The same data can be found on the vertical bar graph by following the end of the bar for year 1999 to the vertical axis. A line graph shows points connected by a line. Each point has a corresponding value for both the horizontal and vertical axes. If you are given a value on the horizontal axis, you can find the point corresponding to that value on the vertical axis. To find out how much profit Compay X made in 1999, you would first locate year 1999 on the horizontal axis. Next, you would find the corresponding point on the vertical axis. The value that point represents on the vertical axis is the profit for 1999. In this example, the profit is $30,000. Sample Problem Use the bar graph to determine how many students earned a B in the class. Follow the end of the bar representing the letter grade B to the vertical axis. The value on the vertical axis is 8, which means that 8 students received a B in that class. 76 Name Class Date Sample Problem Determine how much profit Company Y made in March of 1999. Locate the point associated with March and determine the value on the vertical axis. The value on the vertical axis is 15, which means that Company Y made $15,000 in profit. Now it’s your turn to practice interpreting graphs. Remember to examine the title and the units and labels of each axis to understand what the graph is representing. Use the bar graph below to answer the following questions. 1. How many students received an A? 2. How many students passed the class with a D or higher? 3. What grade did the highest number of students receive? For the line graph below, answer the following questions. 4. How much did Company Y make for the month of May? 5. In what month did Company Y make the most profit? 6. How much did Company Y make for all 5 months? 77 Name Class Date After reading Lesson 6.3, answer the following questions. Trends in Atomic Size 7. What are the atomic radii for the following molecules? Hydrogen atomic radius = Oxygen Nitrogen Chlorine atomic radius = atomic radius = atomic radius = 8. What is the general trend in atomic size within a group? Across a period? 9. What are the two variables that affect atomic size within a group? a. b. 10. For each pair of elements, circle the element with the larger atom. a. helium and argon b. potassium and argon Ions 11. What is an ion? 12. How are ions formed? 13. An ion with a positive charge is called a(n) charge is called a(n) . ; an ion with a negative 14. Complete the table about anions and cations. 0 Anions Cations Charge Metal/Nonmetal Minus sign/Plus sign Trends in Ionization Energy 15. is the energy required to overcome the attraction of protons in the nucleus and remove an electron from a gaseous atom. 16. Why does ionization energy tend to decrease from top to bottom within a group? 78 Name Class Date 17. Why does ionization energy tend to increase as you move across a period? 18. There is a large increase in ionization energy between the second and the third ionization energies of a metal. What kind of ion is the metal likely to form? Include the charge in your answer. Trends in Ionic Size 19. Metallic elements tend to electrons and form ions. Nonmetallic elements tend to electrons and form ions. 20. Circle the letter of the statement that is true about ion size. a. Cations are always smaller than the neutral atoms from which they form. b. Anions are always smaller than the neutral atoms from which they form. c. Within a period, a cation with a greater charge has a larger ionic radius. d. Within a group, a cation with a higher atomic number has a smaller ionic radius. 21. Which ion has the larger ionic radius: Ca2+ or Cl− ? Trends in Electronegativity 22. Use Table 6.2. What trend do you see in the relative electronegativity values of elements within a group? Within a period? 23. Circle the letter of each statement that is true about electronegativity values. a. The electronegativity values of the transition elements are all zero. b. The element with the highest electronegativity value is sodium. c. Nonmetals have higher electronegativity values than metals. d. Electronegativity values can help predict the types of bonds atoms form. 24. Use Figure 6.24. Circle the letter of each property for which aluminum has a higher value than silicon. a. first ionization energy c. electronegativity b. atomic radius d. ionic radius Guided Practice Problems Answer the following questions about Practice Problem 9. Use Figure 6.9 and Figure 6.13 to write the electron configurations of the following elements: a. carbon b. strontium c. vanadium 79 Name Class Date Analyze a. What is the number of electrons for each element? C Sr V b. What is the highest occupied energy sublevel for each element, according to its position on the periodic table? Remember that the energy level for the d block is always one less than the period. C Sr V c. According to its position on the periodic table, how many electrons does each element have in the sublevel listed above? C Sr V Solve d. Begin filling in electron sublevels. Start from the top left and move right across each period in Figure 6.13 until you reach the highest occupied sublevel for each element. Make sure the d block is in the correct energy level. C Sr V e. Add all the superscripts in the electron configurations to check your answers. This sum should equal the atomic number for that element. C Sr V Make a seating chart for students in your class. Seat students according to their birth months and first names. a. Survey your class and write down the first name and birth month of each student. b. Make a seating chart with six columns. Label each column with the name of two consecutive months, starting with January/February and ending with November/December. c. Place student names in the appropriate column in alphabetical order from top to bottom. 1. Suppose a new student named Maria joins the class. Her birthday is in August. Where would she sit? 2. What other categories might you use to seat students? 80 Name Class Date 6 Self-Check Activity For Questions 1–11, complete each statement by writing the correct word or words. If you need help, you can go online. 6.1 Organizing the Elements 1. Early scientists first sorted elements into groups according to their . 2. In Mendeleev’s periodic table, elements were arranged by increasing . 3. Currently, elements are arranged on the periodic table according to increasing . 4. Each element is either a metal, a(n) , or a metalloid. 6.2 Classifying the Elements 5. The periodic table contains much information about the elements, including their , names, and information about the structure of their atoms. 6. Elements can be sorted into groups with similar properties based on their . 6.3 Periodic Trends 7. Atomic size increases from top to bottom within a(n) left to right across a(n) of the periodic table. 8. and from with a positive or negative charge forms when electrons are transferred from one atom to another. 9. The first ionization energy of atoms tends to from top to bottom within a group and from left to right across a period. 10. When an atom loses one or more electrons to form an ion, the ion is than the original atom; when an atom gains one or more electrons to form an ion, the ion is than the original atom. 11. Trends in electronegativity follow the same pattern as trends in . If You Have Trouble With… Question 1 2 3 4 5 6 7 8 9 10 11 See Page 160 161 162 164 167 170 174 176 177 179 181 81 Name Class Date Review Vocabulary Match each of the following with its location on the periodic table, using letters a–i. Use each choice only once. 1. alkali metals 6. metals 2. alkaline earth metals 7. noble gases 3. halogens 8. nonmetals 4. inner transition metals 9. transition metals 5. metalloids Use the letters j–m to show periodic trends in the following properties. The arrows point in the direction the properties increase. Two letters should be in each blank. 10. atomic radius 13. size of anion 11. electronegativity 14. size of cation 12. ionization energy j k m l 82
