readme
advertisement
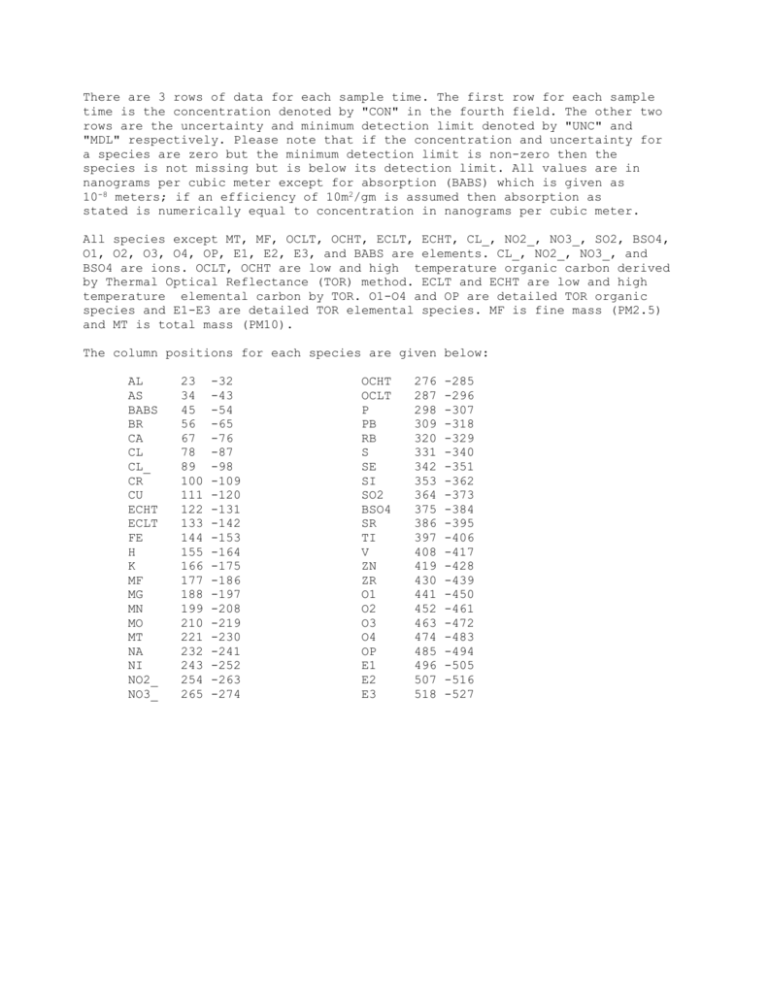
There are 3 rows of data for each sample time. The first row for each sample time is the concentration denoted by "CON" in the fourth field. The other two rows are the uncertainty and minimum detection limit denoted by "UNC" and "MDL" respectively. Please note that if the concentration and uncertainty for a species are zero but the minimum detection limit is non-zero then the species is not missing but is below its detection limit. All values are in nanograms per cubic meter except for absorption (BABS) which is given as 10-8 meters; if an efficiency of 10m2/gm is assumed then absorption as stated is numerically equal to concentration in nanograms per cubic meter. All species except MT, MF, OCLT, OCHT, ECLT, ECHT, CL_, NO2_, NO3_, SO2, BSO4, O1, O2, O3, O4, OP, E1, E2, E3, and BABS are elements. CL_, NO2_, NO3_, and BSO4 are ions. OCLT, OCHT are low and high temperature organic carbon derived by Thermal Optical Reflectance (TOR) method. ECLT and ECHT are low and high temperature elemental carbon by TOR. O1-O4 and OP are detailed TOR organic species and E1-E3 are detailed TOR elemental species. MF is fine mass (PM2.5) and MT is total mass (PM10). The column positions for each species are given below: AL AS BABS BR CA CL CL_ CR CU ECHT ECLT FE H K MF MG MN MO MT NA NI NO2_ NO3_ 23 34 45 56 67 78 89 100 111 122 133 144 155 166 177 188 199 210 221 232 243 254 265 -32 -43 -54 -65 -76 -87 -98 -109 -120 -131 -142 -153 -164 -175 -186 -197 -208 -219 -230 -241 -252 -263 -274 OCHT OCLT P PB RB S SE SI SO2 BSO4 SR TI V ZN ZR O1 O2 O3 O4 OP E1 E2 E3 276 287 298 309 320 331 342 353 364 375 386 397 408 419 430 441 452 463 474 485 496 507 518 -285 -296 -307 -318 -329 -340 -351 -362 -373 -384 -395 -406 -417 -428 -439 -450 -461 -472 -483 -494 -505 -516 -527

