Final Project in Statistics
advertisement
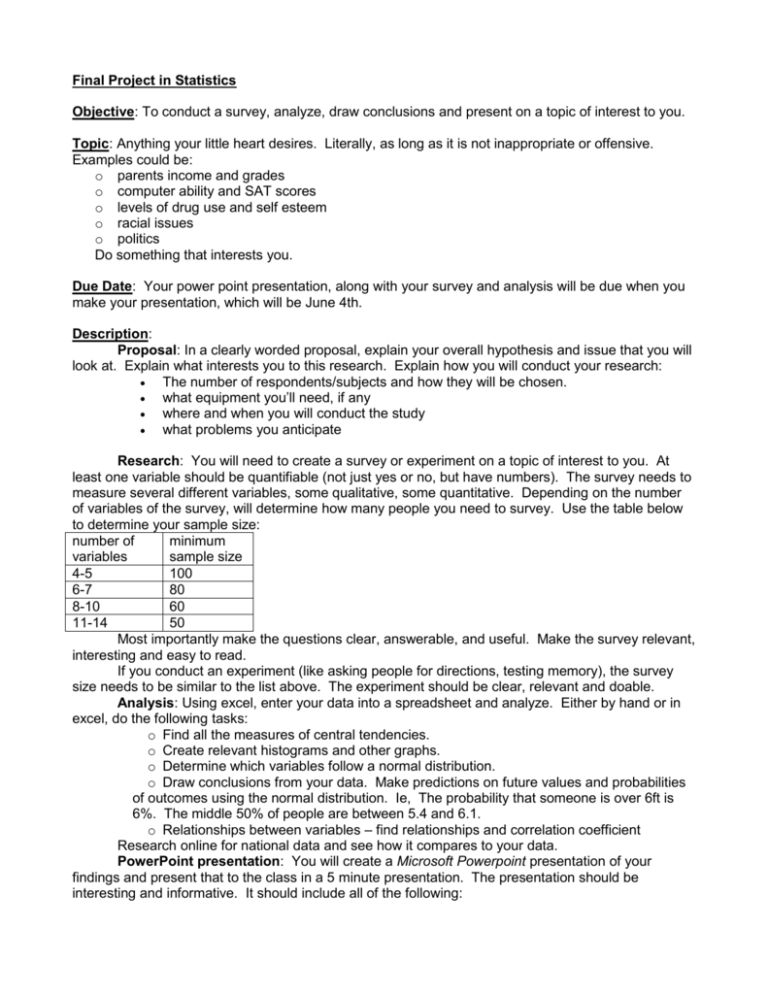
Final Project in Statistics Objective: To conduct a survey, analyze, draw conclusions and present on a topic of interest to you. Topic: Anything your little heart desires. Literally, as long as it is not inappropriate or offensive. Examples could be: o parents income and grades o computer ability and SAT scores o levels of drug use and self esteem o racial issues o politics Do something that interests you. Due Date: Your power point presentation, along with your survey and analysis will be due when you make your presentation, which will be June 4th. Description: Proposal: In a clearly worded proposal, explain your overall hypothesis and issue that you will look at. Explain what interests you to this research. Explain how you will conduct your research: The number of respondents/subjects and how they will be chosen. what equipment you’ll need, if any where and when you will conduct the study what problems you anticipate Research: You will need to create a survey or experiment on a topic of interest to you. At least one variable should be quantifiable (not just yes or no, but have numbers). The survey needs to measure several different variables, some qualitative, some quantitative. Depending on the number of variables of the survey, will determine how many people you need to survey. Use the table below to determine your sample size: number of minimum variables sample size 4-5 100 6-7 80 8-10 60 11-14 50 Most importantly make the questions clear, answerable, and useful. Make the survey relevant, interesting and easy to read. If you conduct an experiment (like asking people for directions, testing memory), the survey size needs to be similar to the list above. The experiment should be clear, relevant and doable. Analysis: Using excel, enter your data into a spreadsheet and analyze. Either by hand or in excel, do the following tasks: o Find all the measures of central tendencies. o Create relevant histograms and other graphs. o Determine which variables follow a normal distribution. o Draw conclusions from your data. Make predictions on future values and probabilities of outcomes using the normal distribution. Ie, The probability that someone is over 6ft is 6%. The middle 50% of people are between 5.4 and 6.1. o Relationships between variables – find relationships and correlation coefficient Research online for national data and see how it compares to your data. PowerPoint presentation: You will create a Microsoft Powerpoint presentation of your findings and present that to the class in a 5 minute presentation. The presentation should be interesting and informative. It should include all of the following: o o o o introduction – explain your survey – why you choose your topic and who and how you surveyed. results –explain your interesting results and the significance of them. Do not list all data values and means – that will be boring and not productive. Find the interesting values. If you were smaller than 5.1 your would be smaller than 95% of the population. The mean SAT score was only 850, but the standard deviation was 150, which means that students different a lot from the mean.... Internet research – explain how your results compare to data compiled nationally. summary – explain your conclusions and anything that was confirmed or you learned from your research. Grading Rubric: Project Part Proposal o Hypothesis reasonable, methods clear and reasonable (10%) What are you going to look at ? 3 Total 10% Why? 2 What do you think the relationship is? 2 Who are you going to survey? 1 How are you surveying 1 Any problems that might arrise? 1 Survey (or experiment) Analysis Presentation o o o o o o o o o o o o o o clear focused survey (5%) good worded questions (5%) visually nice survey (5%) unbiased and random survey (5%) survey conducted successfully (10%) central tendency (5%) histograms and other graphs (5%) determine if normal distribution (5%) compared to internet data (citing sources) (5%) conclusions and relationships (10%) materials well put together (5%) introduction established (5%) results conveyed clearly (10%) conclusion explained (10%) 30% 30% 30% Sign-off Steps: I will need to signoff on: o your proposal – May 23 o your survey – May 25 o your analysis –May 31st Assistance: If you need help at any point, you can email me at borlaj@portlandschools.org. If you need help with any statistical practice see me. Wed (5/24) Signup: Thursday (5/25) Signup: 1. 1. 2. 2. 3. 3. 4. 4. 5. 5. 6. 6. 7. 7. 8. 8. 9. 9. 10. 10. 11. 11.

