Identifying Linear Equations. Graphing Linear Equations
advertisement
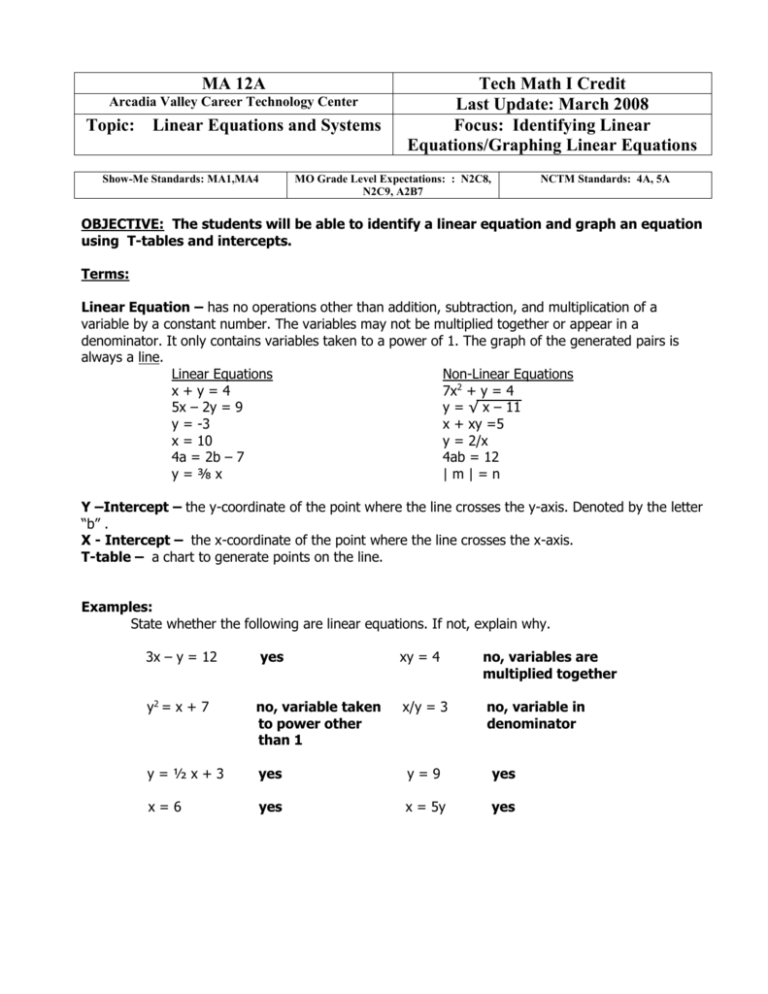
MA 12A Arcadia Valley Career Technology Center Topic: Linear Equations and Systems Show-Me Standards: MA1,MA4 Tech Math I Credit Last Update: March 2008 Focus: Identifying Linear Equations/Graphing Linear Equations MO Grade Level Expectations: : N2C8, N2C9, A2B7 NCTM Standards: 4A, 5A OBJECTIVE: The students will be able to identify a linear equation and graph an equation using T-tables and intercepts. Terms: Linear Equation – has no operations other than addition, subtraction, and multiplication of a variable by a constant number. The variables may not be multiplied together or appear in a denominator. It only contains variables taken to a power of 1. The graph of the generated pairs is always a line. Linear Equations Non-Linear Equations x+y=4 7x2 + y = 4 5x – 2y = 9 y = √ x – 11 y = -3 x + xy =5 x = 10 y = 2/x 4a = 2b – 7 4ab = 12 y=⅜x |m|=n Y –Intercept – the y-coordinate of the point where the line crosses the y-axis. Denoted by the letter “b” . X - Intercept – the x-coordinate of the point where the line crosses the x-axis. T-table – a chart to generate points on the line. Examples: State whether the following are linear equations. If not, explain why. 3x – y = 12 yes xy = 4 no, variables are multiplied together y2 = x + 7 no, variable taken to power other than 1 x/y = 3 no, variable in denominator y=½x+3 yes y=9 yes x=6 yes x = 5y yes GRAPHING LINEAR EQUATI0NS: T-tables, Intercepts, and Horizontal/Vertical Using T-tables: To graph linear equations, we can generate pairs of coordinates that satisfy the equation. We use a T-table to help us generate the pairs. Example: Graph 6x – 2y = 10 using a T-table. -To start, it is usually helpful to solve the equation for the y variable. (In other words, get the y variable all alone on one side of the equal sign). 6x – 2y = 10 6x – 6x – 2y = 10 – 6x -2y = 10 – 6x -2y = 10 – 6x -2 -2 -2 y = -5 + 3x , note 6x – 2y = 10 and y = -5 + 3x represent the same line. -Now, pick some random values for x . 1,-1,0 and any other numbers that may be appropriate are our usual picks. Organize your picks in a T-table. X 1 -1 0 4 Y_ y = -5 + 3(1) = -2 y = -5 + 3(0) = -5 X 1 -1 0 4 Y_ -2 -8 -5 7 y = -5 + 3(-1) = -8 y = -5 + 3(4) = 7 so the pairs generated are (1,-2),(-1,-8),(0,-5),(4,7) -Now graph the pairs and connect them to form the line. y ^ ● (4,7) ● (1,-2) ● ● > x (0,-5) (-1,-8) -there are thousands of pairs that will connect to this line. We chose four to get a look at the direction and steepness of the line. Using Intercepts: To graph using the x and y intercepts, we let x = 0 and y = 0 in our T-table. This method can be quicker since we only have to form two pairs. Example: Graph 3y = 12 – 4x using intercepts. X 0 Y_ 0 3y = 12 – 4(0) 3y = 12 y=4 3(0) = 12 – 4x 0 = 12 – 4x x=3 X 0 3 Y_ 4 0 so the pairs that locate the intercepts of the line are (0,4) and (3,0). -Now graph the intercept pairs. y ^ ● (0,4) ● (3,0) > x Horizontal and Vertical Lines: Horizontal and Vertical lines are the easiest to graph because they are the easiest to identify. No T-table is necessary. Horizontal lines always come in the equation form of y = any number and vertical lines always come in the form x = any number . Example: Graph y = 3 and x = -2 . - y = 3 tells us that no matter what x is, y will always be 3. All pairs will have 3 as their y-coordinate. x = -2 tells us that no matter what y is, x will always be -2. All pairs will have -2 as their x-coordinate. - Now graph. y ^ y ^ ● ● ● ● ● ● ● y=3 ● ● > x ● > x ● x = -2 Problems: Tell whether the following equations are linear equations. If not, explain why. 1. 7x + 5y = 19 2. 7/y = 4x 3. 5 – y = 3 4. 2xy + 6 = y 5. 4x2 – 3x – 5 = 8 6. x = 23 7. 4a3 + b = 7 8. x = ⅓ y 9. y = ½ x – 3 10. | k | + j = 8 Graph the following equations using a T-table. 11. y – 3x = -2 12. 4y + 8 = -16x Graph the following using the intercepts of the line. 13. 5x + 7y = 35 14. 2y = 3x – 6 Graph the following horizontal and vertical lines. 15. y = -5 16. x = 6 17. 4½ = y 18. x = 0
