Mn/DOT Travel Demand Modeling Coordinating Committee
advertisement
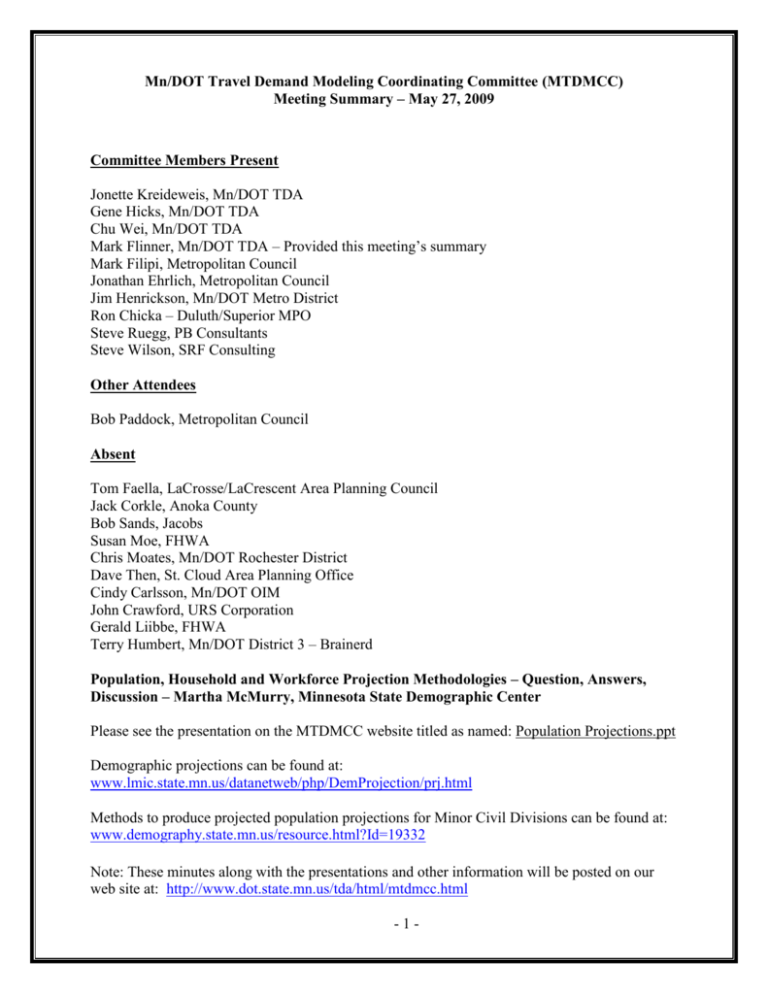
Mn/DOT Travel Demand Modeling Coordinating Committee (MTDMCC) Meeting Summary – May 27, 2009 Committee Members Present Jonette Kreideweis, Mn/DOT TDA Gene Hicks, Mn/DOT TDA Chu Wei, Mn/DOT TDA Mark Flinner, Mn/DOT TDA – Provided this meeting’s summary Mark Filipi, Metropolitan Council Jonathan Ehrlich, Metropolitan Council Jim Henrickson, Mn/DOT Metro District Ron Chicka – Duluth/Superior MPO Steve Ruegg, PB Consultants Steve Wilson, SRF Consulting Other Attendees Bob Paddock, Metropolitan Council Absent Tom Faella, LaCrosse/LaCrescent Area Planning Council Jack Corkle, Anoka County Bob Sands, Jacobs Susan Moe, FHWA Chris Moates, Mn/DOT Rochester District Dave Then, St. Cloud Area Planning Office Cindy Carlsson, Mn/DOT OIM John Crawford, URS Corporation Gerald Liibbe, FHWA Terry Humbert, Mn/DOT District 3 – Brainerd Population, Household and Workforce Projection Methodologies – Question, Answers, Discussion – Martha McMurry, Minnesota State Demographic Center Please see the presentation on the MTDMCC website titled as named: Population Projections.ppt Demographic projections can be found at: www.lmic.state.mn.us/datanetweb/php/DemProjection/prj.html Methods to produce projected population projections for Minor Civil Divisions can be found at: www.demography.state.mn.us/resource.html?Id=19332 Note: These minutes along with the presentations and other information will be posted on our web site at: http://www.dot.state.mn.us/tda/html/mtdmcc.html -1- Major points included the following: Population projections vary from analysis to analysis due to changes in measurements and assumptions about migration, fertility, mortality and land use/infrastructure decisions. Projections are more accurate for geographic areas (states, counties) with larger populations. Projections tend to be less accurate in areas of rapid growth (areas where the demand for new roads is likely the greatest). Accuracy has been evaluated by recognized demographers and by studies of error contained in past Demographic Center projections. Discussion included the following topics: 1) The future looks a lot like the present, 2) Forecasts of future workforce are performed differently in DEED and the differences lead to discussions of perspective and probability of occurrence, 3) We follow U.S. Census mortality guidance, 4) It will be interesting to see how changed retirement patterns may affect population characteristics in various counties, 5) Population is projected with six to ten household types, 6) ACS might be helpful for large population areas and a similar ‘rolling survey’ has been useful for Sidney, Australia for the past nine years. Network Conflation Experience - Lessons Learned and Potential for Future Use – Jonathan Ehrlich, Twin Cities (TC) Metropolitan Council Please see the presentation on the MTDMCC website titled as abbreviated: Conflation.ppt Major points included the following: Conflating network straight-line network to a geographically accurate base map can add realistic imagery and distances to the network, permit data integration using GIS and facilitate error checking. The automated conflating method, even with refinement, required manual but necessary fixes to the resulting network coding. Conflating identified a few old network coding errors and highlighted the need for more detail in certain areas. Model networks, after conflating, will continue to require special illustration of HOT and transit lines. In this proof-of-concept effort, conflating to a NAVTEQ base map led to minor discrepancies when comparing it to the agency’s standard base map. The next phase will incorporate HOT and transit coding. Note: These minutes along with the presentations and other information will be posted on our web site at: http://www.dot.state.mn.us/tda/html/mtdmcc.html -2- Developing Guidance for Travel Demand Modeling In Minnesota Guidance can be very prescribed and detailed or more flexible and general. An example from Virginia was presented as a comprehensive, instructional and detailed form of guidance. Members of this committee are invited to work with MNDOT. Discussion included the following topics: 1) Should guidance be more inspirational or motivational? 2) Minnesota does not have many contiguous MPOs like in the urbanized east and west so our guidance may be different in nature. 3) A statement of ‘why we want to develop guidance’ should facilitate the development of a strategy. 4) We may wish to segregate the large (Metro Council) from the small (all other MPOs). Look more to Iowa and North Carolina for examples. 5) Weigh the cost of modeling with the assessments of benefits to be gained. 6) Modeling activities need to fit each MPO so they need not be the same. 7) Any prescription should include an explanation that explains the importance of following the prescription, and a discussion of tradeoffs that come with following or not following the prescription. 8) Peer review of modeling efforts could lead to guidance. Plan Topics for Sharing with MPOs in a session on August 11th at the annual MPO conference to be held August 10 - 12 in St. Cloud – Jonette Kreideweis 1) Incorporating Uncertainty of Inputs in Travel Forecasting and Travel Demand Modeling - discussion Mark Flinner will develop a question for TMIP to seek peer response before August. The help of this committee to refine the question will be appreciated. It was suggested that we include definitions of terminology when referring to specific types of uncertainty. When choosing to use ranges or comparisons between scenarios, spending extra effort to educate policy makers should lead to an improved understanding of factors that lead to uncertainty. When deciding what areas of uncertainty are important, look for opportunities associated with current and anticipated performance based measures. Private investors in infrastructure development emphasize the importance of risk assessment. 2) Status Update on Developing Guidance for Travel Demand Modeling in Minnesota 3) Update on Microsimulation Activities in Fargo, North Dakota and Moorhead, Minnesota Note: These minutes along with the presentations and other information will be posted on our web site at: http://www.dot.state.mn.us/tda/html/mtdmcc.html -3- Round Robin Traffic Forecasting Flow Diagrams – Chu Wei Please see the presentation on the MTDMCC website titled as: Forecasting Flow Chart.ppt The diagrams were presented as precursors to a larger effort to document forecasting procedures from a comprehensive point-of-view. It was suggested that the effort be shared with the local chapter of ITE or through CTS. Traffic Counting for Detailed Data at Screenlines Update – Mark Flinner Raw axle-hit data has already begun coming into our count program. These files can be used to produce 1, 5, 10, 15, 30 and 60 minute data summaries and graphs so should assist with future time-of-day analysis of traffic for screenline-related analysis. Travel Behavior Inventory in the Twin Cities Metropolitan Area The study is funded and is proceeding. Next meeting : We will be meeting on August 11 at 2:45 PM in conjunction with the MPO Annual Conference in Saint Cloud. We will send a conference brochure and additional details as the date grows closer. Please give us your thoughts about topics for future meetings, or case studies and accomplishments you would like to present... Thank you. Note: These minutes along with the presentations and other information will be posted on our web site at: http://www.dot.state.mn.us/tda/html/mtdmcc.html -4-


