3.17
advertisement
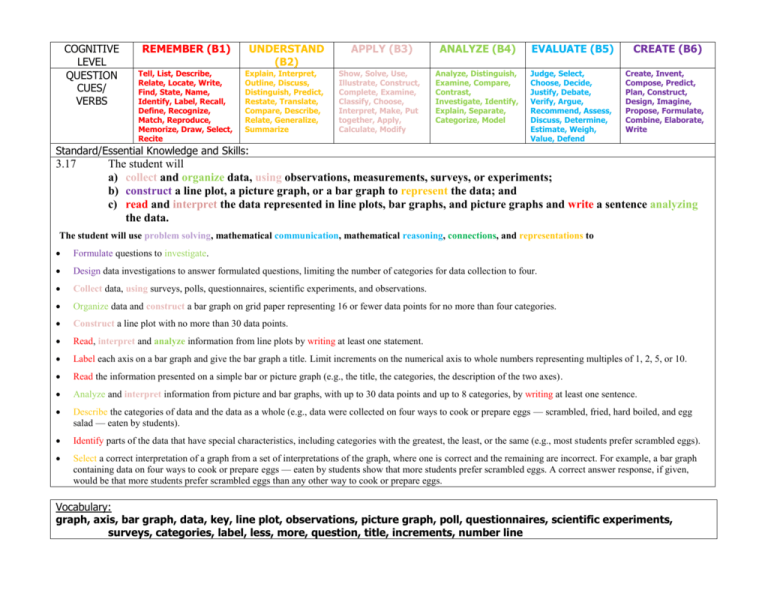
COGNITIVE LEVEL QUESTION CUES/ VERBS REMEMBER (B1) UNDERSTAND (B2) Tell, List, Describe, Relate, Locate, Write, Find, State, Name, Identify, Label, Recall, Define, Recognize, Match, Reproduce, Memorize, Draw, Select, Recite Explain, Interpret, Outline, Discuss, Distinguish, Predict, Restate, Translate, Compare, Describe, Relate, Generalize, Summarize APPLY (B3) Show, Solve, Use, Illustrate, Construct, Complete, Examine, Classify, Choose, Interpret, Make, Put together, Apply, Calculate, Modify ANALYZE (B4) EVALUATE (B5) CREATE (B6) Analyze, Distinguish, Examine, Compare, Contrast, Investigate, Identify, Explain, Separate, Categorize, Model Judge, Select, Choose, Decide, Justify, Debate, Verify, Argue, Recommend, Assess, Discuss, Determine, Estimate, Weigh, Value, Defend Create, Invent, Compose, Predict, Plan, Construct, Design, Imagine, Propose, Formulate, Combine, Elaborate, Write Standard/Essential Knowledge and Skills: 3.17 The student will a) collect and organize data, using observations, measurements, surveys, or experiments; b) construct a line plot, a picture graph, or a bar graph to represent the data; and c) read and interpret the data represented in line plots, bar graphs, and picture graphs and write a sentence analyzing the data. The student will use problem solving, mathematical communication, mathematical reasoning, connections, and representations to Formulate questions to investigate. Design data investigations to answer formulated questions, limiting the number of categories for data collection to four. Collect data, using surveys, polls, questionnaires, scientific experiments, and observations. Organize data and construct a bar graph on grid paper representing 16 or fewer data points for no more than four categories. Construct a line plot with no more than 30 data points. Read, interpret and analyze information from line plots by writing at least one statement. Label each axis on a bar graph and give the bar graph a title. Limit increments on the numerical axis to whole numbers representing multiples of 1, 2, 5, or 10. Read the information presented on a simple bar or picture graph (e.g., the title, the categories, the description of the two axes). Analyze and interpret information from picture and bar graphs, with up to 30 data points and up to 8 categories, by writing at least one sentence. Describe the categories of data and the data as a whole (e.g., data were collected on four ways to cook or prepare eggs — scrambled, fried, hard boiled, and egg salad — eaten by students). Identify parts of the data that have special characteristics, including categories with the greatest, the least, or the same (e.g., most students prefer scrambled eggs). Select a correct interpretation of a graph from a set of interpretations of the graph, where one is correct and the remaining are incorrect. For example, a bar graph containing data on four ways to cook or prepare eggs — eaten by students show that more students prefer scrambled eggs. A correct answer response, if given, would be that more students prefer scrambled eggs than any other way to cook or prepare eggs. Vocabulary: graph, axis, bar graph, data, key, line plot, observations, picture graph, poll, questionnaires, scientific experiments, surveys, categories, label, less, more, question, title, increments, number line Assessment Type and Cognitive Level: Homework Assignments: Formative: Monday Tuesday Wednesday Summative: Thursday Friday MONDAY TUESDAY WEDNESDAY THURSDAY FRIDAY ------------------------- ------------------------ ----------------------- --------------------- ----------------------- ------------------------- ------------------------ ----------------------- --------------------- ----------------------- ------------------------- ------------------------ ----------------------- --------------------- ----------------------- A Different iation (Above, On, and/or Below Grade Level) Learning Plan, Activities, Planned Questions (Include time allotted to specific activities) Hook/ Essential Question DATE O Reflection Closure B
