AP Statistics
advertisement
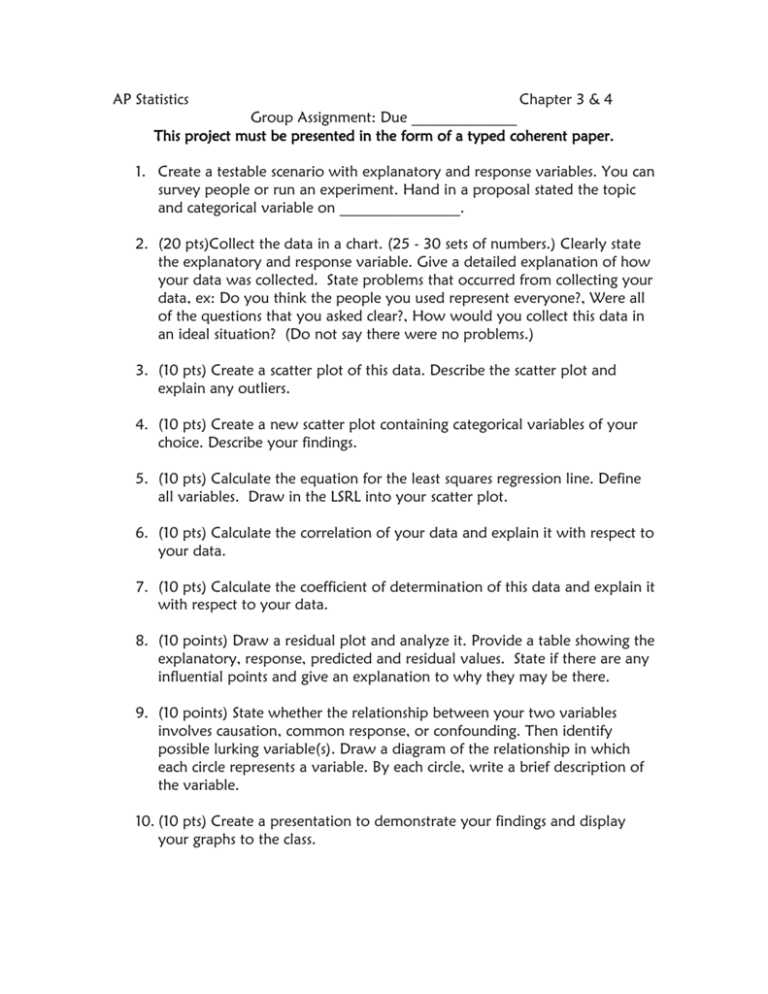
AP Statistics Chapter 3 & 4 Group Assignment: Due ______________ This project must be presented in the form of a typed coherent paper. 1. Create a testable scenario with explanatory and response variables. You can survey people or run an experiment. Hand in a proposal stated the topic and categorical variable on ________________. 2. (20 pts)Collect the data in a chart. (25 - 30 sets of numbers.) Clearly state the explanatory and response variable. Give a detailed explanation of how your data was collected. State problems that occurred from collecting your data, ex: Do you think the people you used represent everyone?, Were all of the questions that you asked clear?, How would you collect this data in an ideal situation? (Do not say there were no problems.) 3. (10 pts) Create a scatter plot of this data. Describe the scatter plot and explain any outliers. 4. (10 pts) Create a new scatter plot containing categorical variables of your choice. Describe your findings. 5. (10 pts) Calculate the equation for the least squares regression line. Define all variables. Draw in the LSRL into your scatter plot. 6. (10 pts) Calculate the correlation of your data and explain it with respect to your data. 7. (10 pts) Calculate the coefficient of determination of this data and explain it with respect to your data. 8. (10 points) Draw a residual plot and analyze it. Provide a table showing the explanatory, response, predicted and residual values. State if there are any influential points and give an explanation to why they may be there. 9. (10 points) State whether the relationship between your two variables involves causation, common response, or confounding. Then identify possible lurking variable(s). Draw a diagram of the relationship in which each circle represents a variable. By each circle, write a brief description of the variable. 10. (10 pts) Create a presentation to demonstrate your findings and display your graphs to the class.
