Extra Material, Week 10
advertisement
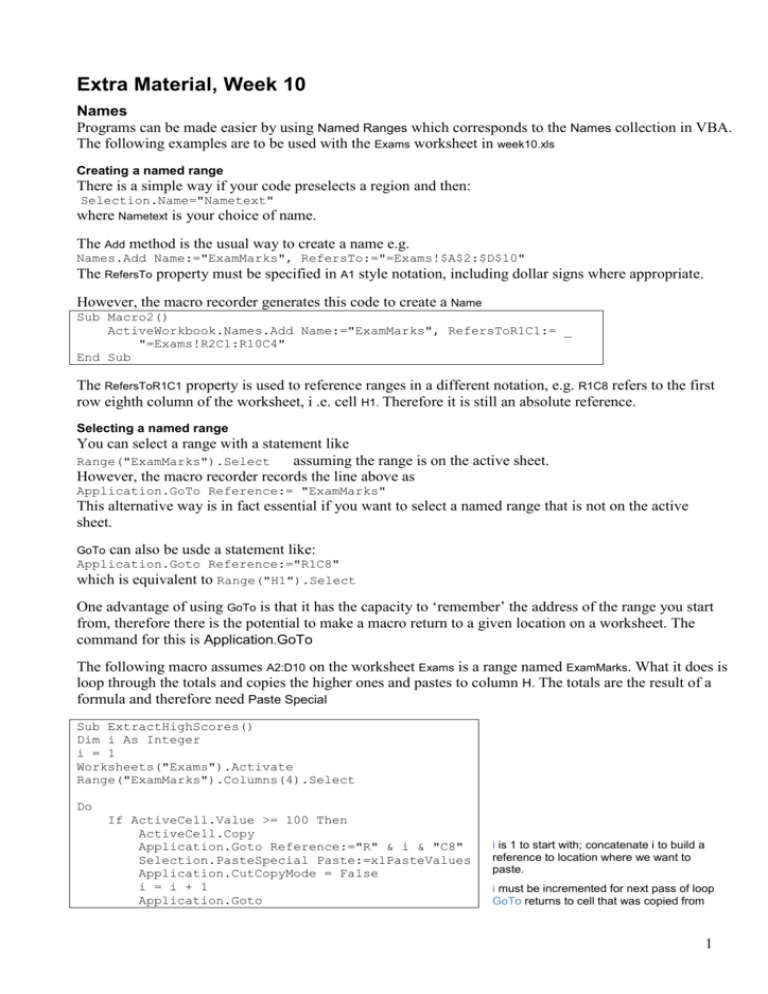
Extra Material, Week 10 Names Programs can be made easier by using Named Ranges which corresponds to the Names collection in VBA. The following examples are to be used with the Exams worksheet in week10.xls Creating a named range There is a simple way if your code preselects a region and then: Selection.Name="Nametext" where Nametext is your choice of name. The Add method is the usual way to create a name e.g. Names.Add Name:="ExamMarks", RefersTo:="=Exams!$A$2:$D$10" The RefersTo property must be specified in A1 style notation, including dollar signs where appropriate. However, the macro recorder generates this code to create a Name Sub Macro2() ActiveWorkbook.Names.Add Name:="ExamMarks", RefersToR1C1:= _ "=Exams!R2C1:R10C4" End Sub The RefersToR1C1 property is used to reference ranges in a different notation, e.g. R1C8 refers to the first row eighth column of the worksheet, i .e. cell H1. Therefore it is still an absolute reference. Selecting a named range You can select a range with a statement like Range("ExamMarks").Select assuming the range is on the active sheet. However, the macro recorder records the line above as Application.GoTo Reference:= "ExamMarks" This alternative way is in fact essential if you want to select a named range that is not on the active sheet. GoTo can also be usde a statement like: Application.Goto Reference:="R1C8" which is equivalent to Range("H1").Select One advantage of using GoTo is that it has the capacity to ‘remember’ the address of the range you start from, therefore there is the potential to make a macro return to a given location on a worksheet. The command for this is Application.GoTo The following macro assumes A2:D10 on the worksheet Exams is a range named ExamMarks. What it does is loop through the totals and copies the higher ones and pastes to column H. The totals are the result of a formula and therefore need Paste Special Sub ExtractHighScores() Dim i As Integer i = 1 Worksheets("Exams").Activate Range("ExamMarks").Columns(4).Select Do If ActiveCell.Value >= 100 Then ActiveCell.Copy Application.Goto Reference:="R" & i & "C8" Selection.PasteSpecial Paste:=xlPasteValues Application.CutCopyMode = False i = i + 1 Application.Goto i is 1 to start with; concatenate i to build a reference to location where we want to paste. i must be incremented for next pass of loop GoTo returns to cell that was copied from 1 End If ActiveCell.Offset(1, 0).Select Loop Until ActiveCell = "" End Sub If you want to copy and paste both the name and mark to the new location there is only one alteration to make. The line ActiveCell.Copy (line 9) becomes Union(ActiveCell, ActiveCell.Offset(0, -3)).Copy It’s useful to step through this macro and watch it work. Use the macro recorder to make a chart Click the Insert tab on the ribbon and start recording a macro. Click the Column button and choose the first 2D column chart in the window that follows. Stop recording, delete the chart, but keep the code. The code has potential for re-use if you change the reference to the range. Excel 2007/10 code is shorter than what follows, but I’ve retained the code from the Chart Wizard so you can see the way to change the Chart Title and remove the legend. Sub MakeChart() Selection.CurrentRegion.Select Charts.Add ActiveChart.ChartType = xlColumnClustered ActiveChart.SetSourceData Source:=Sheets("Exams").Range("A1:B10"), PlotBy:= _ xlColumns ActiveChart.Location Where:=xlLocationAsObject, Name:="Exams" With ActiveChart .HasTitle = True .ChartTitle.Characters.Text = "Exam Marks" .Axes(xlCategory, xlPrimary).HasTitle = False .Axes(xlValue, xlPrimary).HasTitle = False End With ActiveChart.HasLegend = False End Sub Here is the suggested chart code for this exercise: Sub MakeExamChart() Dim chartdata As Range Set chartdata = Selection.CurrentRegion ActiveSheet.Shapes.AddChart.Select ActiveChart.SetSourceData Source:= chartdata ActiveChart.ChartType = xlColumnClustered ActiveChart.HasTitle = True ActiveChart.ChartTitle.Text = "High Scores" ActiveChart.HasLegend = False End Sub We are at the point of being able to extract the high exam scores, paste them to another region, and chart them. You could now put it all together as follows: 2 Sub ExtractAndChart() ExtractHighScores Range("H1").Select MakeExamChart End Sub ‘ keyword Call is optional Redefining a named range after adding data to it There is no method that ‘redefines’ the address of an existing named range, for example, once you have added or deleted data from it. What you do is to use Names.Add to add the range again with the updated dimensions. Rather than struggling to concatenate the update literal range reference an easier way is to make your code select the range, then use a reference to Selection for the RefersTo argument. For example, Names.Add Name:="ExamMarks", RefersTo:= Selection which could be written more tersely Names.Add "ExamMarks", Selection There are other ways to accomplish this, e.g. code for the form on the worksheet Data in week 10 uses concatenation. Creating Names from a Selection There is a very efficient way to create names from existing worksheet data. Given a selectiont as illustrated below . . . . . . select the Formulas ribbon, click Create from Selection and if you select only the Top Row checkbox, Excel will create names from each of the selected column headings i.e. Date, Open, High and so on. The code for this is would be: Selection.CreateNames Top:=True, Left:=False, Bottom:=False, Right:=False Working with two ranges in parallel It is possible to process two (or more) ranges in parallel by using the same loop. Using the ftse worksheet, there are two named ranges Close03 and Close02. The following program simply colours the font red if the closing price for each month in 2003 is lower than for the corresponding month in 2002, and green if it is higher. The code takes advantage of the fact that the two ranges are of the same size and can use the count property of one or the other as the upper bound of the For loop: For i = 1 To close03.count On the other hand you might have to code a test to see which range is larger, if for example you were comparing one month’s prices of a share with the corresponding month the previous year (there may have been less or more trading days). 3 Sub CompareRanges() Dim i As Integer Dim close03 As Range, close02 As Range Set close03 = Range("Close2003") Set close02 = Range("Close2002") For i = 1 To close03.count If close03(i) < close02(i) Then close03(i).Font.Color = vbRed Else close03(i).Font.Color = vbGreen End If Next i End Sub Note also the use of range variables using Set, which makes the code more compact. Compare the above For loop with the following code that works with the ranges directly: For i = 1 To Range("Close2003").Cells.count If Range("Close2003").Cells(i) < Range("Close2002").Cells(i) Then Range("Close2003")(i).Font.Color = vbRed End If Next i Resize property of a range A range has a resize property, which will seem intimidating to beginners. However, with a little thought it can be understood and used. Here is an example which demonstrates it, though is not terribly useful. The code resizes a selection by one row and one column. Sub ResizeDemo() Dim numrows As Integer Dim numcolumns As Integer numrows = Selection.Rows.Count numcolumns = Selection.Columns.Count Selection.Resize(numrows + 1, numcolumns + 1).Select ' omit either row or column argument to leave size as it is End Sub Now consider this selection: The statement Selection.Offset(1,0).Select has the following effect 4 which isn’t quite the answer. However this reference can be resized to get rid of the last blank row and effectively you have an expression to select a selection without its header which would be ideal for copy and paste operations. Sub SelectWithoutHeader() 'resizes table of data so it 'loses' the header Dim tbl As Range Set tbl = ActiveCell.CurrentRegion tbl.Offset(1, 0).Resize(tbl.Rows.Count - 1, _ tbl.Columns.Count).Select End Sub Can you determine whether the active cell is in a particular named range? Yes, with some difficulty. Assuming you want to test if the active cell is in a named range called ExamMarks then the following expression gives True Union(ActiveCell,Range("ExamMarks")).Address = Range("ExamMarks").Address Worksheet_Change Event The Change event of a worksheet happens when data is changed. This could be by means of an external data link like Bloomberg. Assuming a named range called Prices, here is a program that changes the colour of numeric cells; the code is triggered by a change to the value of any cell on the worksheet. Private Sub Worksheet_Change(ByVal Target As Range) Dim r As Range For Each r In Range("prices") If IsNumeric(r) And Not IsEmpty(r) Then If r >= 16 Then r.Font.Color = vbGreen ElseIf r < 15 Then r.Font.Color = vbRed Else r.Font.Color = vbBlack End If End If Next r End Sub 5 Tutorial: Make a Line Chart We will create data to work out the cosine of an angle then make a line chart from it. First the code to create the data. Sub Dim Set Dim For MakeData() startcell As Range startcell = ActiveCell i As Integer i = -180 To 180 Step 15 ActiveCell = i ActiveCell.Font.Bold = True ActiveCell.Offset(1, 0) = Round(Cos(Degree2Radian(ActiveCell)), 3) ActiveCell.Offset(0, 1).Select Next i startcell.Select startcell.CurrentRegion.Columns.AutoFit End Sub Also need this function to convert the degrees to radians. Function Degree2Radian(z As Single) As Single ' excel's trig. functions work with radians not degrees hence need to convert Degree2Radian = z * WorksheetFunction.Pi / 180 End Function Code to create the chart, assuming the data is in B7:B8 Sub MakeWave1() 'assumes data is B7:Z8 ActiveSheet.Shapes.AddChart.Select ActiveChart.ChartType = xlLine ActiveChart.SetSourceData Source:=Range("'Sheet2'!$B$8:$Z$8") 'recorded code to modify the axis ActiveChart.SeriesCollection(1).XValues = "='Sheet2'!$B$7:$Z$7" 'every second label otherwise looks cramped ActiveChart.Axes(xlCategory).TickLabelSpacing = 2 ActiveChart.HasLegend = False End Sub This is a more general solution; you should study the difference to the above. Sub MakeWave2() 'assumes active cell is in the data to be charted Dim r As Range Set r = Selection.CurrentRegion ActiveSheet.Shapes.AddChart.Select ActiveChart.ChartType = xlLine ActiveChart.SetSourceData Source:=r.Rows(2) 'recorded code to modify the axis ActiveChart.SeriesCollection(1).XValues = r.Rows(1) 'every second label otherwise looks cramped ActiveChart.Axes(xlCategory).TickLabelSpacing = 2 ActiveChart.HasLegend = False End Sub 6 How to modify the chart in Excel; you could record these steps to get the code. 1. Initial appearance of chart 2. Right-click and choose Select Data 3. Select Series1 and click Remove 4. Series2 is visible; next we format the x-axis 5. Choose Select Data as in step 2, click the Edit button on the right 6. Select the range that contains the axis. You should see the labels. Click OK 7. Right-click the horizontal axis and choose Format Axis. Click Specify interval unit, type 2. Close. 8. Remove the legend manually and the chart is complete 7
