Application Note Number 103: Use of Trend Mode XML Data in Excel
advertisement
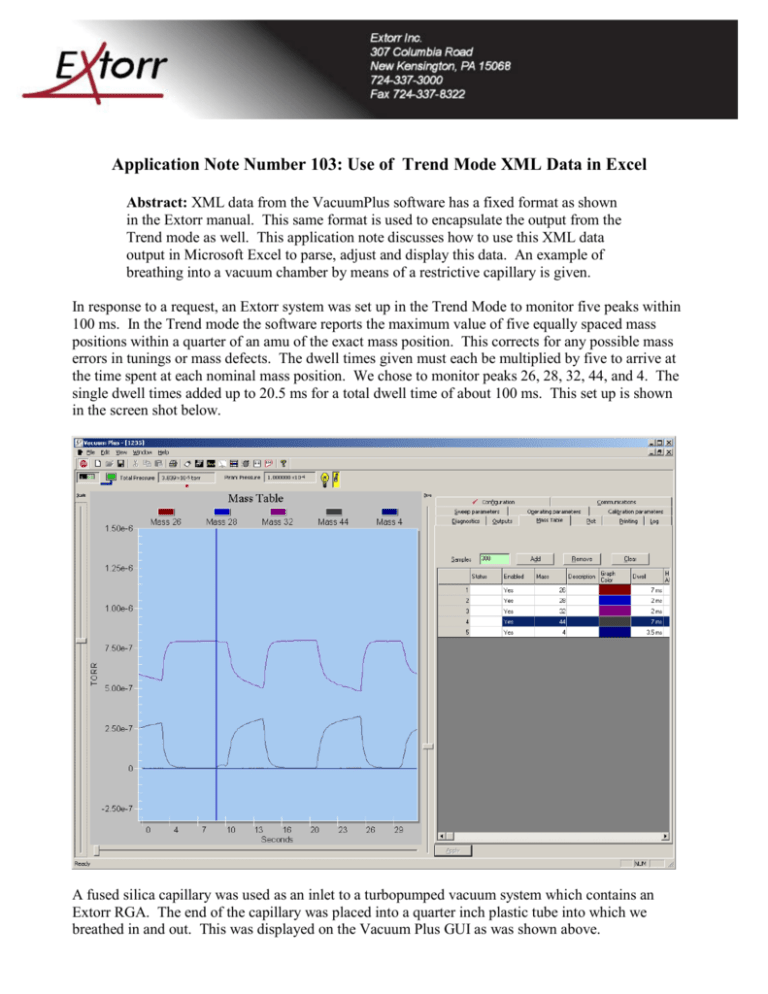
Application Note Number 103: Use of Trend Mode XML Data in Excel Abstract: XML data from the VacuumPlus software has a fixed format as shown in the Extorr manual. This same format is used to encapsulate the output from the Trend mode as well. This application note discusses how to use this XML data output in Microsoft Excel to parse, adjust and display this data. An example of breathing into a vacuum chamber by means of a restrictive capillary is given. In response to a request, an Extorr system was set up in the Trend Mode to monitor five peaks within 100 ms. In the Trend mode the software reports the maximum value of five equally spaced mass positions within a quarter of an amu of the exact mass position. This corrects for any possible mass errors in tunings or mass defects. The dwell times given must each be multiplied by five to arrive at the time spent at each nominal mass position. We chose to monitor peaks 26, 28, 32, 44, and 4. The single dwell times added up to 20.5 ms for a total dwell time of about 100 ms. This set up is shown in the screen shot below. A fused silica capillary was used as an inlet to a turbopumped vacuum system which contains an Extorr RGA. The end of the capillary was placed into a quarter inch plastic tube into which we breathed in and out. This was displayed on the Vacuum Plus GUI as was shown above. The data shown on the graph is available for further analysis by exporting it using the File>Save as XML sequence. The accumulated data is placed in an XML formatted file which may be read in a browser. This data may then also be imported into any other program which supports the XML format. In particular, the file may be imported into Microsoft Excel using Data>Import External Data>Import Data. Just insert the name and location of your file in the resulting file dialog box and the data is entered into Excel in the form below. Note that this is the same data format as the sweep data. The only part of the data which is useful is the information in column J. Also note that the data is given in groups of five, one data point for each of the masses in one time interval. It is now not that easy to do further analysis on this data manually but Excel macros may be written in VBA to deconvolute the data. The macro below asks for information about the data set, the name of the file on the desktop and then sorts each mass output in its own column. Sub Deconvolute() ' ' Deconvolute() will ask for .xml files located in the C: directory. ' Information about the data set is asked for and the single data ' column will deconvolute into single mass columns . ' ActiveCell.FormulaR1C1 = "# Samples" 'Fill out new column labels. Range("C1").Select ActiveCell.FormulaR1C1 = "Mass1" Range("D1").Select ActiveCell.FormulaR1C1 = "Mass2" Range("E1").Select ActiveCell.FormulaR1C1 = "Mass3" Range("F1").Select ActiveCell.FormulaR1C1 = "Mass4" Range("G1").Select ActiveCell.FormulaR1C1 = "Mass5" Range("H1").Select ActiveCell.FormulaR1C1 = "Mass6" Range("I1").Select ActiveCell.FormulaR1C1 = "Mass7" Range("J1").Select ActiveCell.FormulaR1C1 = "Mass8" Range("K1").Select ActiveCell.FormulaR1C1 = "Mass9" Range("L1").Select ActiveCell.FormulaR1C1 = "Mass10" Range("B1").Select ActiveCell.FormulaR1C1 = "# Masses" Range("A2").Select ActiveCell.FormulaR1C1 = InputBox("Enter the number of sampes taken") Range("B2").Select ActiveCell.FormulaR1C1 = InputBox("Enter the number of masses measured") Range("C2").Select ' Input masses used For x = 1 To Range("B2") ActiveCell.FormulaR1C1 = InputBox("Enter Mass") ActiveCell.Offset(0, 1).Select Next ' Input .xml file starting at "A3". Range("A3").Select Filename$ = InputBox("Enter name of file located in C: on desktop(do not type .xml extension)") With ActiveSheet.QueryTables.Add(Connection:= _ "FINDER;C:\" + Filename$ + ".xml", _ Destination:=Range("A3")) .Name = "Breath" .FieldNames = True .RowNumbers = False .FillAdjacentFormulas = False .PreserveFormatting = True .RefreshOnFileOpen = False .BackgroundQuery = True .RefreshStyle = xlInsertDeleteCells .SavePassword = False .SaveData = True .AdjustColumnWidth = True .RefreshPeriod = 0 .WebSelectionType = xlAllTables .WebFormatting = xlWebFormattingNone .WebPreFormattedTextToColumns = True .WebConsecutiveDelimitersAsOne = True .WebSingleBlockTextImport = False .WebDisableDateRecognition = False .WebDisableRedirections = False .Refresh BackgroundQuery:=False End With 'Clean out unused headers. Range("A3:P4").Select Selection.Delete Shift:=xlUp Range("A3:I1503").Select Selection.Delete Shift:=xlToLeft 'Do the deconvolution. For x = 0 To Range("A2") For z = 1 To Range("B2") y$ = Chr(66 + z) + Trim(Str$(x + 4)) Range("A3").Select Selection.Cut Range(y$).Select ActiveSheet.Paste Range("A3").Select Selection.Delete Shift:=xlUp Selection.Cut Next z Next x End Sub As we do this, we can also do further analysis. For instance, the data was taken in terms of partial pressures in torr. If we would like the results in terms of percentage, a first order result would be given by multiplying each value by 100 and dividing by the sum of all readings in each time interval. This could be further refined by multiplying each mass output by a sensitivity value which takes into account the relative cross section for ionization and the cracking pattern for each of the gases being monitored. We also need to establish a time base by placing the time taken for each sample. The macro below does this for the data above. Sub Analyze5() ' Uses relative sensitivity factors of 1.07 for Oxygen and ' 0.8 for Carbon dioxide, normalizes data to 100% and places ' new data in columns I through G For x = 1 To Range("A2") Range("I" + Trim(Str$(x + 3))).Select ActiveCell.FormulaR1C1 = _ "=RC[-6]*100/(RC[-6]+RC[-5]+1.07*RC[-4]+0.8*RC[-3]+RC[-2])" Range("J" + Trim(Str$(x + 3))).Select ActiveCell.FormulaR1C1 = _ "=RC[-6]*100/(RC[-7]+RC[-6]+1.07*RC[-5]+0.8*RC[-4]+RC[-3])" Range("K" + Trim(Str$(x + 3))).Select ActiveCell.FormulaR1C1 = _ "=RC[-6]*107/(RC[-8]+RC[-7]+1.07*RC[-6]+0.8*RC[-5]+RC[-4])" Range("L" + Trim(Str$(x + 3))).Select ActiveCell.FormulaR1C1 = _ "=RC[-6]*80/(RC[-9]+RC[-8]+1.07*RC[-7]+0.8*RC[-6]+RC[-5])" Range("M" + Trim(Str$(x + 3))).Select ActiveCell.FormulaR1C1 = _ "=RC[-6]*100/(RC[-10]+RC[-9]+1.07*RC[-8]+0.8*RC[-7]+RC[-6])" Next End Sub and displays the data on a plot as a function of time. Time data may then be applied by the MakeTime macro below. Sub MakeTime() ' ' MakeTime Macro ' This asks for the time information and makes time ' Range("H4").Select TimeInt = InputBox("Enter the sum of the dwell times for the sampes taken.") For x = 1 To Range("A2") ActiveCell.Value = 5 * x * TimeInt ActiveCell.Offset(1, 0).Select Next x End Sub Finally this data may be plotted using the plot macro below. Sub MakeTrendPlot5() ' ' MakeTrendPlot5 Macro ' Range("H4:M303").Select Range("M303").Activate Charts.Add ActiveChart.ChartType = xlXYScatterSmoothNoMarkers ActiveChart.SetSourceData Source:=Sheets("Sheet1").Range("H4:M303"), PlotBy _ :=xlColumns ActiveChart.SeriesCollection(1).Name = "=""26""" ActiveChart.SeriesCollection(2).Name = "=""28""" ActiveChart.SeriesCollection(3).Name = "=""32""" ActiveChart.SeriesCollection(4).Name = "=""44""" ActiveChart.SeriesCollection(5).Name = "=""4""" ActiveChart.Location Where:=xlLocationAsObject, Name:="Sheet1" With ActiveChart .HasTitle = True .ChartTitle.Characters.Text = "Breathing" .Axes(xlCategory, xlPrimary).HasTitle = True .Axes(xlCategory, xlPrimary).AxisTitle.Characters.Text = "Time (seconds)" .Axes(xlValue, xlPrimary).HasTitle = True .Axes(xlValue, xlPrimary).AxisTitle.Characters.Text = "Molecular Percent" End With Windows("SortTrend .xls").ScrollRow = 3 Windows("SortTrend .xls").ScrollRow = 2 Windows("SortTrend .xls").ScrollRow = 1 ActiveSheet.Shapes("Chart 1").IncrementLeft -284.25 ActiveSheet.Shapes("Chart 1").IncrementTop -192# ActiveWindow.Visible = False Windows("SortTrend .xls").Activate Range("Q31").Select End Sub The net result of all of these macros is the Excel Page below. This, of course, is not the complete picture of breath analysis since, for instance, we did not deal with water vapor which is also vastly different for the inhaled and exhaled air. This note is only intended to show how Excel macros may be used to refine and display raw data.
