Mplus User's Guide
advertisement
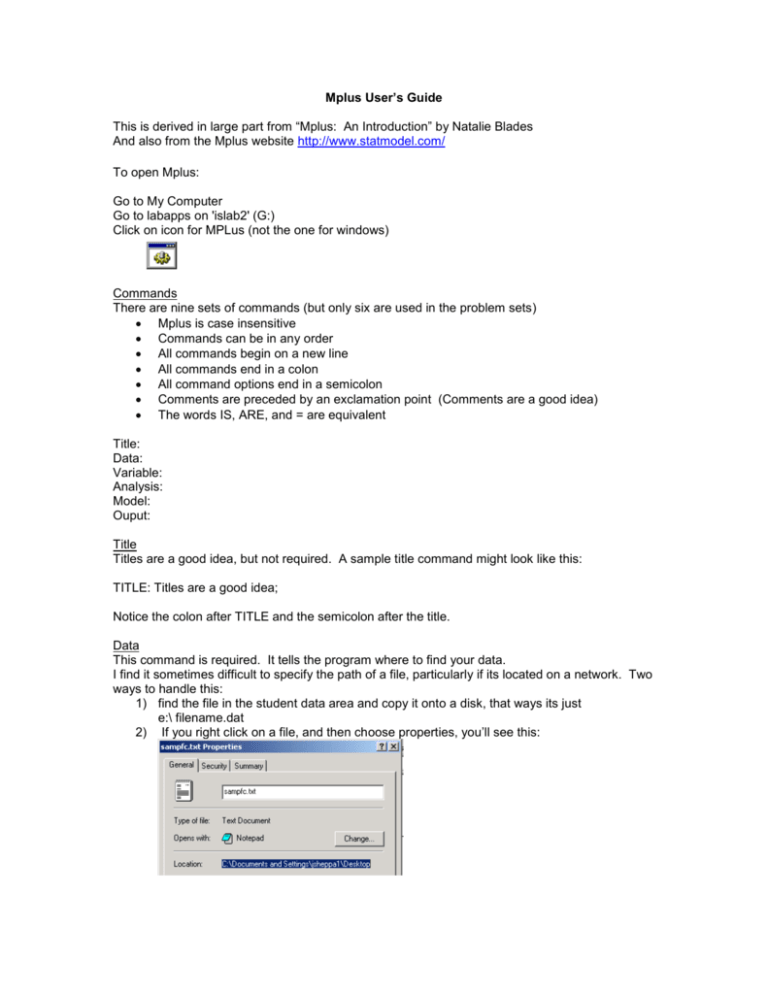
Mplus User’s Guide This is derived in large part from “Mplus: An Introduction” by Natalie Blades And also from the Mplus website http://www.statmodel.com/ To open Mplus: Go to My Computer Go to labapps on 'islab2' (G:) Click on icon for MPLus (not the one for windows) Commands There are nine sets of commands (but only six are used in the problem sets) Mplus is case insensitive Commands can be in any order All commands begin on a new line All commands end in a colon All command options end in a semicolon Comments are preceded by an exclamation point (Comments are a good idea) The words IS, ARE, and = are equivalent Title: Data: Variable: Analysis: Model: Ouput: Title Titles are a good idea, but not required. A sample title command might look like this: TITLE: Titles are a good idea; Notice the colon after TITLE and the semicolon after the title. Data This command is required. It tells the program where to find your data. I find it sometimes difficult to specify the path of a file, particularly if its located on a network. Two ways to handle this: 1) find the file in the student data area and copy it onto a disk, that ways its just e:\ filename.dat 2) If you right click on a file, and then choose properties, you’ll see this: You can cut and paste the path from here into your Mplus Syntax A sample data command would look like this: DATA: File is e:\ps2.dat; Variable This is required. If you open up the dataset in wordpad or a text editor, you’ll notice that there are no variable names. If you had made your own dataset, you would want to be extra sure that the variables were in the order you thought they were in. With the variable command, you give the variables names. An example of a variable command is: Variable: Names are slf1-slf10 cesd1-cesd7; Notice this is the same shortcut as in stata. If you want to specify that certain variables are categorical, then you would do this: Variable: Names are slf1-slf10 cesd1-cesd7; Categorical are slf1-slf10 cesd1-cesd7; Names and Categorical are both options of Variable. If you are doing latent class analysis, you need to name both your observed variables and your proposed classes. Variable: Names are u1-u6; Classes = c(2); the number in parentheses is the number of proposed classes. Categorical = u1-u6; Analysis This says what type of analysis you’ll be using. For exploratory data analysis, you would use: Analysis: type = EFA # #; The two #’s are the minimum and maximum number of factors you want extracted. For latent class regression, you would use: Analysis: type = mixture; Model No model specification is necessary for EFA Model specification is necessary for latent class analysis. %Overall% refers to the model common to all latent classes. %c#1% refers to the model related to the first class (remember you named them in the variable command) Now you need to specify your starting values: these are the conditional probabilities: Note: these are in logit scale. Here’s how to calculate them using a Excel. In column A, type some probabilities. In column B, type the formula for transforming from a probability to a logit: p Logit ( p) ln 1 p In cell B1, type this formula. The formula is =ln(a1/(1-a1)) In the lower left hand corner of cell B1, double click, this will fill down all the logits. Next highlight the B column, choose edit, paste special, values. Hit OK. Next, highlight the B column, and cut and paste them into the Mplus window, then you can look at them, as you type the commands. The specification of conditional probabilities will look like this: %c#1% [u1$1*-2 u2$1*-2 u3$1*-2 u4$1*-2]; %c#2% [u1$1*-1 u2$1*-1 u3$1*-1 u4$1*-1]; The %c#1% means you are talking about class 1. U1$1*-2 is an action-packed command U1 means the variable named U1. You would change this if your variables were named something else. $1 means this is the starting logit corresponding to the probability of a positive (1) response on this variable. We will only be doing latent class analysis with dichotomous (Yes/No) indicators. If you had trichotomous indicators (Yes/No/Maybe), you would also have to specify a starting value for U1$2. The asterisk means it’s a starting value, it’s not fixed. -2 is the starting value for that conditional probability in logit scale. Output In order to output sample stats, you would use the following command: OUTPUT: Sampstats; Following are some examples from the Mplus website of EFA and LCA: You want to download the examples for both continuous and categorical outcome analysis, and for mixture models. cont1.std - example of factor analysis. cat1.std - categorical factor analysis. mix1.std - latent class analysis.
