Alpha from Tetrachoric Correlations: MPLUS & SPSS Guide
advertisement
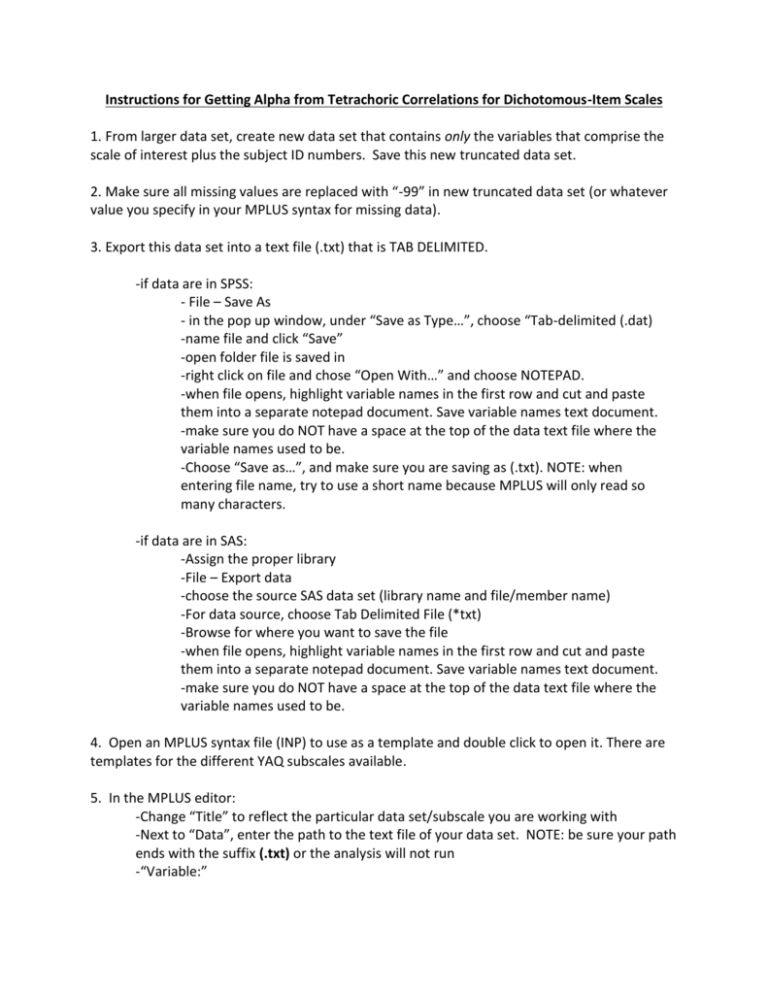
Instructions for Getting Alpha from Tetrachoric Correlations for Dichotomous-Item Scales 1. From larger data set, create new data set that contains only the variables that comprise the scale of interest plus the subject ID numbers. Save this new truncated data set. 2. Make sure all missing values are replaced with “-99” in new truncated data set (or whatever value you specify in your MPLUS syntax for missing data). 3. Export this data set into a text file (.txt) that is TAB DELIMITED. -if data are in SPSS: - File – Save As - in the pop up window, under “Save as Type…”, choose “Tab-delimited (.dat) -name file and click “Save” -open folder file is saved in -right click on file and chose “Open With…” and choose NOTEPAD. -when file opens, highlight variable names in the first row and cut and paste them into a separate notepad document. Save variable names text document. -make sure you do NOT have a space at the top of the data text file where the variable names used to be. -Choose “Save as…”, and make sure you are saving as (.txt). NOTE: when entering file name, try to use a short name because MPLUS will only read so many characters. -if data are in SAS: -Assign the proper library -File – Export data -choose the source SAS data set (library name and file/member name) -For data source, choose Tab Delimited File (*txt) -Browse for where you want to save the file -when file opens, highlight variable names in the first row and cut and paste them into a separate notepad document. Save variable names text document. -make sure you do NOT have a space at the top of the data text file where the variable names used to be. 4. Open an MPLUS syntax file (INP) to use as a template and double click to open it. There are templates for the different YAQ subscales available. 5. In the MPLUS editor: -Change “Title” to reflect the particular data set/subscale you are working with -Next to “Data”, enter the path to the text file of your data set. NOTE: be sure your path ends with the suffix (.txt) or the analysis will not run -“Variable:” -“Names are” : if necessary change variable names to match those of the scale you are using. Easiest way is to copy and paste the variable names from notepad where you saved them. -NOTE: try to keep the formatting (i.e. line length, spacing, etc.) as similar as possible to the template when entering different variable names. MPLUS will be extremely touchy in how it reads variable names and may cut them off and fail to run the analysis. If your analysis fails, check the output window to see if MPLUS cut off your variable names. If so, you may have to adjust the formatting several times to get MPLUS to read it properly. -“Usevariables are”: Enter the variable names of all variables included in the current subscale of interest. -“Categorical are”: Enter variable names of all categorical variables, which should be identical to “use variables” list. -BASICALLY, YOU ARE JUST GOING TO TELL MPLUS THAT THE ITEMS ARE CATEGORICAL VARIABLES, THEN GET MPLUS TO GENERATE A CORRELATION MATRIX FOR YOU. SINCE YOU SPECIFICED THE VARIABLES AS CATEGORICAL, TETRACHORIC CORRELATIONS ARE AUTOMATICALLY GENERATED -Leave all other syntax the same –SHOULD HAVE WLSMV AS ESTIMATOR AND THAT “SAMPSTAT” IS IN YOUR OUTPUT COMMAND -Go to “FILE – SAVE AS…” and rename it to reflect data set/subscale you are working with. NOTE: you will have to do this step because MPLUS will ask you to save changes before running analysis and it will save over the template. -Click “RUN” 6. You WILL get a warning saying “ All variables are uncorrelated with all other variables in the model. Check that this is what is intended” That’s ok, because you’re not building a model, just generating the sample correlation matrix. 7. Scroll down to SAMPLE STATISTICS Section. There will be a CORRELATION MATRIX there. This is your matrix of TETRACHORIC CORRELATIONS (this has been verified by the Muthen’s on their website). 7. If the analysis failed, try to find out why by reading the warnings. Likely reasons for failing are problems with formatting variable names, incorrect file path, etc. 7. Copy and paste correlation matrix into new NOTEPAD file. Save file. 8. Open SPSS, Click “Cancel” on Pop-up window, and go to “File – READ TEXT DATA…” -in pop-up window, find and select saved text file of correlation matrix, click “OPEN” -in next window, check to see that you can see all correlations in preview window, then click “NEXT” -click “NEXT” several more times until you get to the last step and then click “FINISH” -delete all variable labels/unnecessary items from the cells in the data editor -cut and paste correlations so they are all in the first column -click on “VARIABLE VIEW” tab at bottom right of spreadsheet -For the first variable, under “TYPE” – click on the cell and change it to “NUMERIC” -under “DECIMALS” enter “3” -Go to “ANALYZE – DESCRIPTIVES – DESCRPTIVES” -move the first variable over into the variable box and click OK 9. The output file will give you the MEAN, which is the mean tetrachoric correlation for the scale. Use that mean and plug it in to the formula below to calculate Alpha for the scale: alpha = (N * mean r) / [1 + (N-1)(mean r)] Where N is the NUMBER OF ITEMS in the scale, and mean r is the mean of the tetrachoric correlations in the matrix. 10. Alternatively, for scales with fewer items, it may be easier to skip step 8 and just calculate the mean of the correlations in the tetrachoric correlation matrix by hand.
