Quiz 1
advertisement
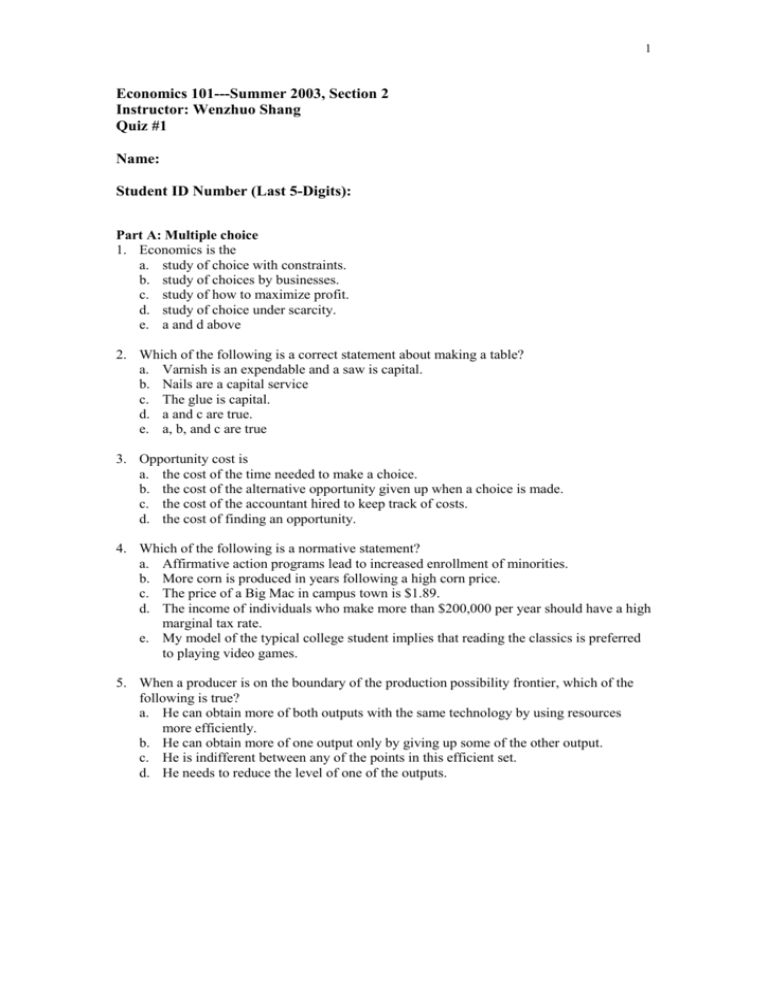
1 Economics 101---Summer 2003, Section 2 Instructor: Wenzhuo Shang Quiz #1 Name: Student ID Number (Last 5-Digits): Part A: Multiple choice 1. Economics is the a. study of choice with constraints. b. study of choices by businesses. c. study of how to maximize profit. d. study of choice under scarcity. e. a and d above 2. Which of the following is a correct statement about making a table? a. Varnish is an expendable and a saw is capital. b. Nails are a capital service c. The glue is capital. d. a and c are true. e. a, b, and c are true 3. Opportunity cost is a. the cost of the time needed to make a choice. b. the cost of the alternative opportunity given up when a choice is made. c. the cost of the accountant hired to keep track of costs. d. the cost of finding an opportunity. 4. Which of the following is a normative statement? a. Affirmative action programs lead to increased enrollment of minorities. b. More corn is produced in years following a high corn price. c. The price of a Big Mac in campus town is $1.89. d. The income of individuals who make more than $200,000 per year should have a high marginal tax rate. e. My model of the typical college student implies that reading the classics is preferred to playing video games. 5. When a producer is on the boundary of the production possibility frontier, which of the following is true? a. He can obtain more of both outputs with the same technology by using resources more efficiently. b. He can obtain more of one output only by giving up some of the other output. c. He is indifferent between any of the points in this efficient set. d. He needs to reduce the level of one of the outputs. 2 Part B: Problem Solving 1. A certain economy produces only two consumer goods, X and Y. Only labor is required to produce both goods, and the economy’s labor force is fixed at 100 workers. The table indicates the amount of X and Y that can be produced with various quantities of labor. Number of workers 0 20 40 60 80 100 X production Number of workers Y production 0 10.0 20.0 25.0 27.5 30.0 0 20 40 60 80 100 0 150 250 325 375 400 (a) Draw the production possibility frontier for this economy, using the graph below. (Connect the points with straight lines) (b) What is the opportunity cost of producing the first 10 units of good X? What is the opportunity cost of producing the next 10 units of X? What happens to the opportunity cost of X as more is produced? (c) Suppose the actual production for a given period is 20 units of X and 250 units of Y. Is this production efficient? Why or why not? (d) Suppose that a central planner in this economy calls for an output combination of X=30 and Y=150. Is this attainable? Why or why not? 3 (e) New technology is developed to produce X so that each worker now can produce double the amount of X indicated in the schedule. What happens to the production possibility frontier? Draw the new curve on the same graph. Can the planner’s output combination in (d) now be met? 2. Consider two countries, Britain and Canada and both of them produce gin and wheat with land as the only resource. Britain has totally 10 million acres of land and could produce 1 million gallons of gin with 2 acres of land and 1 million bushels of wheat with 1 acre of land. Correspondingly, Canada has totally 16 million acres of land and could produce 1 million gallons of gin with 4 acres of land and 1 million bushels of wheat with 1 acre of land. (a) Draw the production possibility frontier for each country in the graphs below. Label point A on Britain’s PPF, where 2 million bushels of wheat is produced. Label point B on Canada’s PPF, where 8 million bushels of wheat is produced. (b) Which country has the comparative advantage in producing wheat? And in producing gin? Explain. (c) Draw the PPF for the 2-country economy, where specialization occurs according to comparative advantages. (Draw it in the last graph) (d) Suppose that before the specialization, Britain and Canada were producing at points A and B (in part (a)), respectively. Calculate the total amount of wheat and gin produced by the two countries, in this case. Mark this combination of the two outputs on the graph you draw in part (c) and find whether this point is efficient or not under specialization. What can you say about this finding? 12 Gallons of Gin(millions) 10 8 6 4 2 0 0 2 4 6 8 10 Bushels of Wheat (millions) Britain 12 14 16 4 12 Gallons of Gin (millions) 10 8 6 4 2 0 0 2 4 6 8 10 12 14 16 Bushels of Wheat (millions) Canada 12 Gallons of Gin (millions) 10 8 6 4 2 0 0 2 4 6 8 10 12 14 16 18 20 22 Bushels of Wheat (millions) 24 26 28 30
