How Does Industry Market Structure Affect Price and Output
advertisement
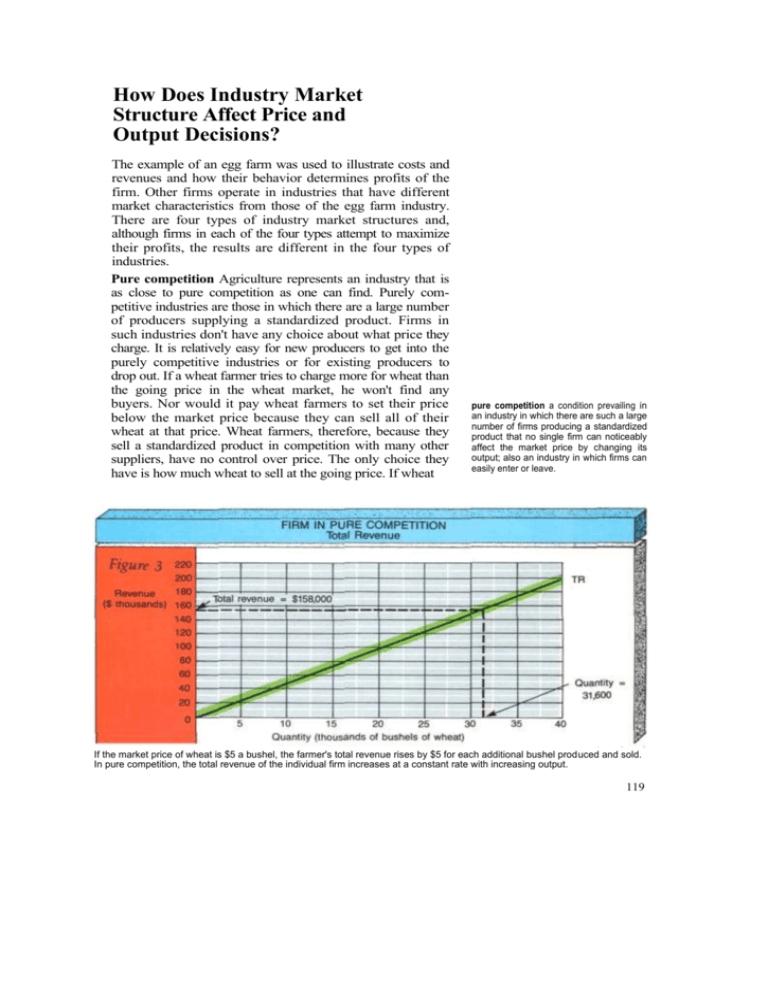
How Does Industry Market Structure Affect Price and Output Decisions? The example of an egg farm was used to illustrate costs and revenues and how their behavior determines profits of the firm. Other firms operate in industries that have different market characteristics from those of the egg farm industry. There are four types of industry market structures and, although firms in each of the four types attempt to maximize their profits, the results are different in the four types of industries. Pure competition Agriculture represents an industry that is as close to pure competition as one can find. Purely competitive industries are those in which there are a large number of producers supplying a standardized product. Firms in such industries don't have any choice about what price they charge. It is relatively easy for new producers to get into the purely competitive industries or for existing producers to drop out. If a wheat farmer tries to charge more for wheat than the going price in the wheat market, he won't find any buyers. Nor would it pay wheat farmers to set their price below the market price because they can sell all of their wheat at that price. Wheat farmers, therefore, because they sell a standardized product in competition with many other suppliers, have no control over price. The only choice they have is how much wheat to sell at the going price. If wheat pure competition a condition prevailing in an industry in which there are such a large number of firms producing a standardized product that no single firm can noticeably affect the market price by changing its output; also an industry in which firms can easily enter or leave. If the market price of wheat is $5 a bushel, the farmer's total revenue rises by $5 for each additional bushel produced and sold. In pure competition, the total revenue of the individual firm increases at a constant rate with increasing output. 119 This combine can harvest enough wheat in 9 seconds to provide flour to make 70 loaves of bread. Wheat farming is a purely competitive business, and wheat farmers cannot raise prices to increase revenues. is selling for $5 a bushel, their total revenue will be $5 multiplied by the number of bushels they sell, as shown by the total revenue curve in Figure 3 on page 119. The yearly quantity of wheat produced on the farm is shown along the bottom axis. The revenue from sale of the wheat is shown on the vertical axis. The total revenue is the price per bushel times the number of bushels sold (TR = P x Q). This is shown by the TR curve on the diagram. The farmer's revenue, beginning at zero with zero output, would rise at a constant rate with each additional bushel of wheat produced and sold. At an output of 31,600 bushels the total revenue is $158,000 ($5 x 31,600 bushels). The wheat farmer's costs are shown in Figure 4. The fixed costs are $62,000, whatever the level of output. This fixed cost includes not only depreciation on the buildings and equipment and interest on the borrowed capital, but also an allowance for the normal rate of return on the farmer's own capital invested in the farm and his management input. The variable costs are added to the fixed costs, depending on how much wheat is produced. They include seed, fertilizer, irrigation water, and hired labor costs. The total costs are the sum of the fixed and variable costs. Total costs are $140,000 at an output of 31,600 bushels of wheat. Notice that costs go up at an increasing rate, especially after about 25,000 bushels, as shown by the TC curve rising more and more steeply. Wheat farmers can increase wheat production by using more seed, fertilizer, and irrigation and by cultivating land more intensively. But if the amount of land on which they are growing wheat is fixed, costs per The total costs for each level of output are the fixed costs plus the variable costs. Variable costs go up at an increasing rate because of diminishing returns. 120

