ID:______ Name:______ Due day: 2013.10.18 Homework #1
advertisement
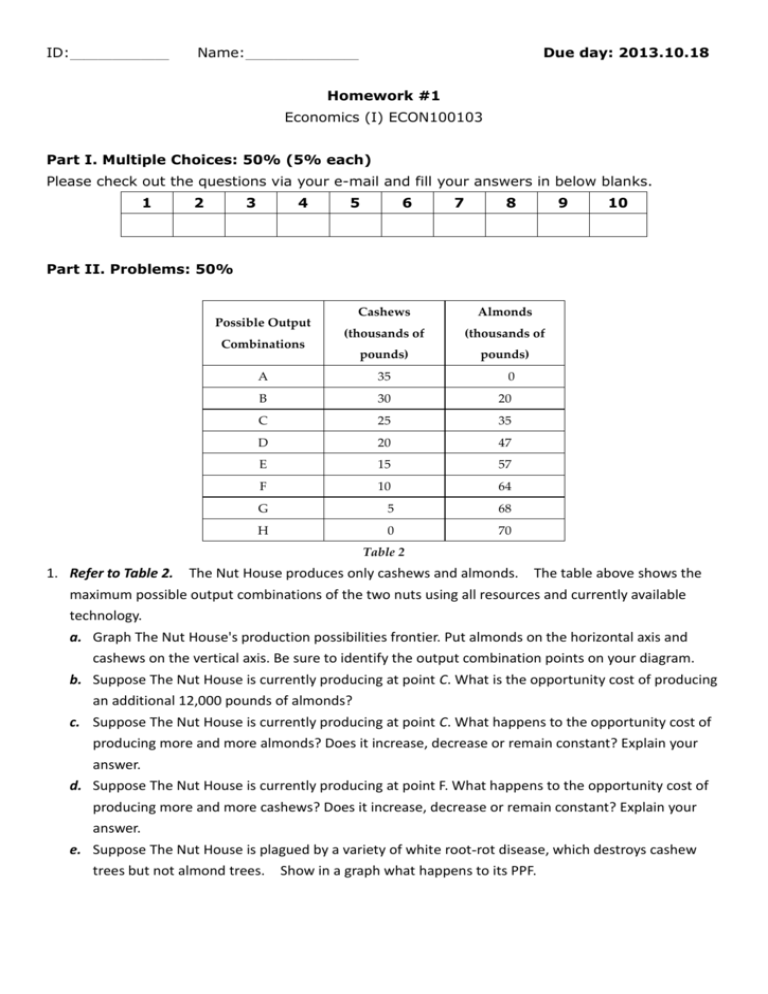
ID:_______ Name:________ Due day: 2013.10.18 Homework #1 Economics (I) ECON100103 Part I. Multiple Choices: 50% (5% each) Please check out the questions via your e-mail and fill your answers in below blanks. 1 2 3 4 5 6 7 8 9 10 Part II. Problems: 50% Possible Output Combinations Cashews Almonds (thousands of (thousands of pounds) pounds) A 35 0 B 30 20 C 25 35 D 20 47 E 15 57 F 10 64 G 5 68 H 0 70 Table 2 1. Refer to Table 2. The Nut House produces only cashews and almonds. The table above shows the maximum possible output combinations of the two nuts using all resources and currently available technology. a. Graph The Nut House's production possibilities frontier. Put almonds on the horizontal axis and cashews on the vertical axis. Be sure to identify the output combination points on your diagram. b. Suppose The Nut House is currently producing at point C. What is the opportunity cost of producing an additional 12,000 pounds of almonds? c. Suppose The Nut House is currently producing at point C. What happens to the opportunity cost of producing more and more almonds? Does it increase, decrease or remain constant? Explain your answer. d. Suppose The Nut House is currently producing at point F. What happens to the opportunity cost of producing more and more cashews? Does it increase, decrease or remain constant? Explain your answer. e. Suppose The Nut House is plagued by a variety of white root-rot disease, which destroys cashew trees but not almond trees. Show in a graph what happens to its PPF. Digital Camera Wheat (bushels) China 100 hours 5 hours South Korea 90 hours 3 hours Table 3 2. Refer to Table 3. This table shows the number of labor hours required to produce a digital camera and a bushel of wheat in China and South Korea. a. If each country has a total of 9,000 labor hours to devote to the production of the two goods, draw the production possibilities frontier for each country. Put "Digital Camera" on the horizontal axis and "Wheat" on the vertical axis. Be sure to identify the intercept values on your graphs. b. Suppose each country allocates 60% its labor hours to wheat production and 40% to the production of digital cameras. Complete Table 4 below to show each country's output of the two products. Table 4: Production and Consumption with no Trade Digital Camera Output Wheat Output (bushels) China South Korea Total c. If the two countries do not trade and consume whatever they produce, identify the current production and consumption point for each country on their respective production possibilities frontiers. Label China's consumption point "C" and South Korea's consumption point, "K." d. Suppose the two countries specialize and trade. Who should produce digital cameras and who should produce wheat? Explain your answer. e. Complete Table 5 below to show each country's output with specialization. Table 5: Output with Specialization Digital Camera Output Wheat Output (bushels) China South Korea Total f. Did specialization increase the combined output for the two countries without any increase in resources? If so, by how much? g. Suppose China and South Korea agree to trade so that in exchange for 1,200 bushels of wheat, the exporter of wheat receives 48 digital cameras. Complete Table 6 below to show each country's consumption bundle after trade. Table 6: Consumption with Trade Digital Camera Wheat (bushels) China South Korea h. Show the consumption points after trade on each country's production possibilities frontier. Label these points "B" for China and "J" for South Korea. i. Has trade made the two countries better off? Explain your answer.
