Constructing a boiling point / composition diagram - "Chem-A
advertisement
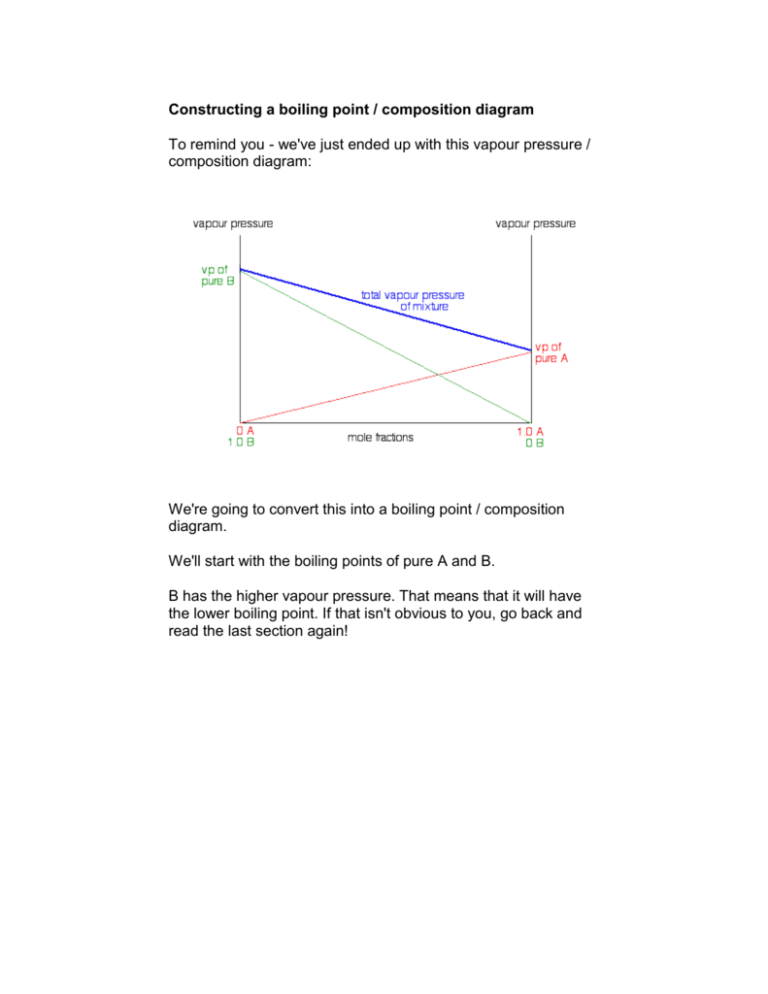
Constructing a boiling point / composition diagram To remind you - we've just ended up with this vapour pressure / composition diagram: We're going to convert this into a boiling point / composition diagram. We'll start with the boiling points of pure A and B. B has the higher vapour pressure. That means that it will have the lower boiling point. If that isn't obvious to you, go back and read the last section again! For mixtures of A and B, you might perhaps have expected that their boiling points would form a straight line joining the two points we've already got. Not so! In fact, it turns out to be a curve. Important: Take great care drawing this curve. The boiling point of B is the lowest boiling point. Don't let your curve droop below this. That happens with certain non-ideal mixtures and has consequences which are explored on another page. To make this diagram really useful (and finally get to the phase diagram we've been heading towards), we are going to add another line. This second line will show the composition of the vapour over the top of any particular boiling liquid. If you boil a liquid mixture, you would expect to find that the more volatile substance escapes to form a vapour more easily than the less volatile one. That means that in the case we've been talking about, you would expect to find a higher proportion of B (the more volatile component) in the vapour than in the liquid. You can discover this composition by condensing the vapour and analysing it. That would give you a point on the diagram. The diagram just shows what happens if you boil a particular mixture of A and B. Notice that the vapour over the top of the boiling liquid has a composition which is much richer in B - the more volatile component. If you repeat this exercise with liquid mixtures of lots of different compositions, you can plot a second curve - a vapour composition line. This is now our final phase diagram. Important: Once again, take great care drawing this second curve. No point on the curve must be higher than the boiling temperature of the pure A. Using the phase diagram The diagram is used in exactly the same way as it was built up. If you boil a liquid mixture, you can find out the temperature it boils at, and the composition of the vapour over the boiling liquid. For example, in the next diagram, if you boil a liquid mixture C1, it will boil at a temperature T1 and the vapour over the top of the boiling liquid will have the composition C2. All you have to do is to use the liquid composition curve to find the boiling point of the liquid, and then look at what the vapour composition would be at that temperature. Notice again that the vapour is much richer in the more volatile component B than the original liquid mixture was. The beginnings of fractional distillation Suppose that you collected and condensed the vapour over the top of the boiling liquid and reboiled it. You would now be boiling a new liquid which had a composition C2. That would boil at a new temperature T2, and the vapour over the top of it would have a composition C3. You can see that we now have a vapour which is getting quite close to being pure B. If you keep on doing this (condensing the vapour, and then reboiling the liquid produced) you will eventually get pure B. This is obvious the basis for fractional distillation. However, doing it like this would be incredibly tedious, and unless you could arrange to produce and condense huge amounts of vapour over the top of the boiling liquid, the amount of B which you would get at the end would be very small.


