Finding Epicenters and Measuring Magnitudes Worksheet
Name: ________________________________________________ Date: ______________________ Class: _________________
Finding Epicenters and Measuring Magnitudes Worksheet
Objective : To use seismic data and an interactive simulation to triangulate the location and measure the magnitude of an earthquake.
Materials : Work in pairs sharing one computer with Internet access.
Engage:
1.
You may have heard news coverage saying something like “the earthquake was a 6.3 on the Richter scale” or “the epicenter was located just outside the city.” Describe in your journal what you think these statements mean.
Explore: Navigate to the Earthquakes Living Lab at http://www.teachengineering.org/livinglabs/earthquakes/.
2.
The Earthquakes Living Lab has four main components to it, each based on one of four historic earthquakes. For this activity, select the “Mexico” box.
3.
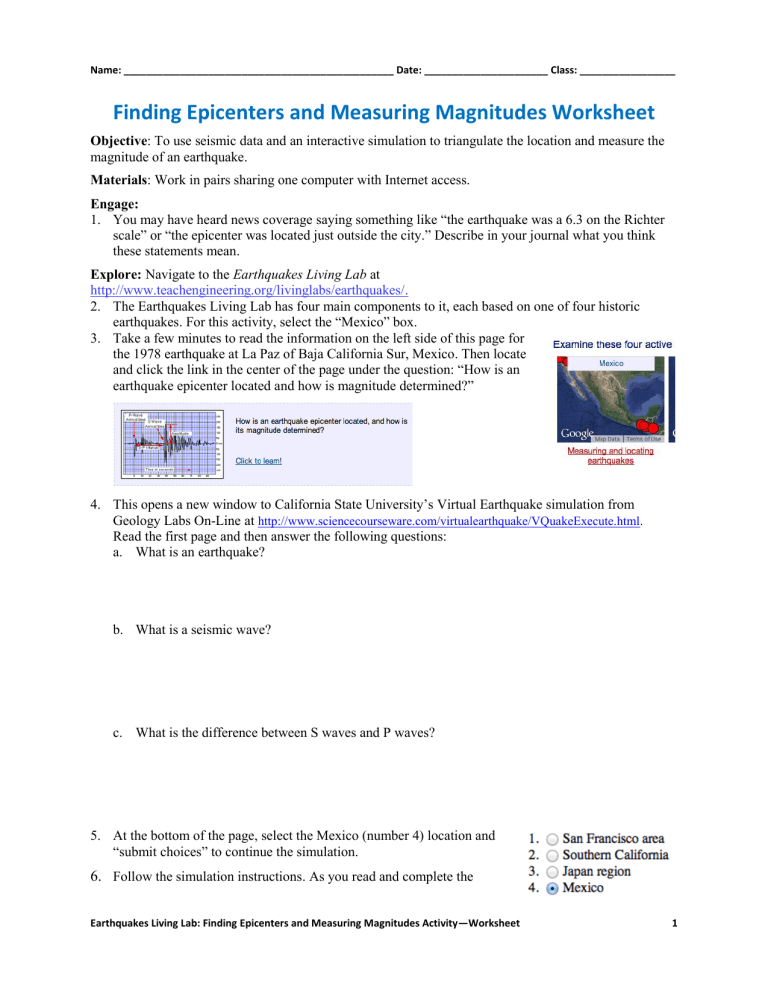
Take a few minutes to read the information on the left side of this page for the 1978 earthquake at La Paz of Baja California Sur, Mexico. Then locate and click the link in the center of the page under the question: “How is an earthquake epicenter located and how is magnitude determined?”
4.
This opens a new window to California State University’s Virtual Earthquake simulation from
Geology Labs On-Line at http://www.sciencecourseware.com/virtualearthquake/VQuakeExecute.html
.
Read the first page and then answer the following questions: a.
What is an earthquake? b.
What is a seismic wave? c.
What is the difference between S waves and P waves?
5.
At the bottom of the page, select the Mexico (number 4) location and
“submit choices” to continue the simulation.
6.
Follow the simulation instructions. As you read and complete the
Earthquakes Living Lab: Finding Epicenters and Measuring Magnitudes Activity—Worksheet 1
Name: ________________________________________________ Date: ______________________ Class: _________________ activity, take notes so you can complete the Explain questions next.
Earthquakes Living Lab: Finding Epicenters and Measuring Magnitudes Activity—Worksheet 2
Name: ________________________________________________ Date: ______________________ Class: _________________
Explain:
7.
How is an earthquake located?
8.
What is an epicenter?
9.
How are S waves and P waves used to determine how far away epicenters are?
10.
How does distance from the epicenter affect the S-P time interval?
11.
Describe the process of triangulation to locate an epicenter.
12.
What is the “magnitude” of an earthquake? Describe it.
13.
What data is used to determine magnitude?
Earthquakes Living Lab: Finding Epicenters and Measuring Magnitudes Activity—Worksheet 3
Name: ________________________________________________ Date: ______________________ Class: _________________
Elaborate:
14.
Why might the triangulation method not always produce an exact point (other than any measurement errors)?
15.
How does distance from the epicenter affect the magnitude (height) of the seismograph reading?
Evaluate:
16.
Some scientists and educators believe seismology (locating, measuring and predicting earthquakes) is a very reliable science and will one day allow us to predict future earthquakes. Other scientists and educators believe seismology is not a very exact science. Write a paragraph (or more) to express your opinion on this topic. Based on what you learned in this activity, is locating and measuring earthquakes a well-defined science? Be sure to include details from the Explore and Elaborate questions. Including some sketches and/or images is helpful, such as an image of a seismograph with key features labeled to support your explanation.
17.
How do you think engineers use seismic data? Include specific examples.
Congratulations—you have completed this activity!
Feel free to complete the “virtual seismologist” information at the end of the simulation to get your virtual certificate. For more practice, return to the beginning of the simulation and complete the steps again for one or more of the other locations.
Earthquakes Living Lab: Finding Epicenters and Measuring Magnitudes Activity—Worksheet 4
