AMS -007 / Spring 2009 Instructor: Abel Rodriguez Practice Midterm
advertisement
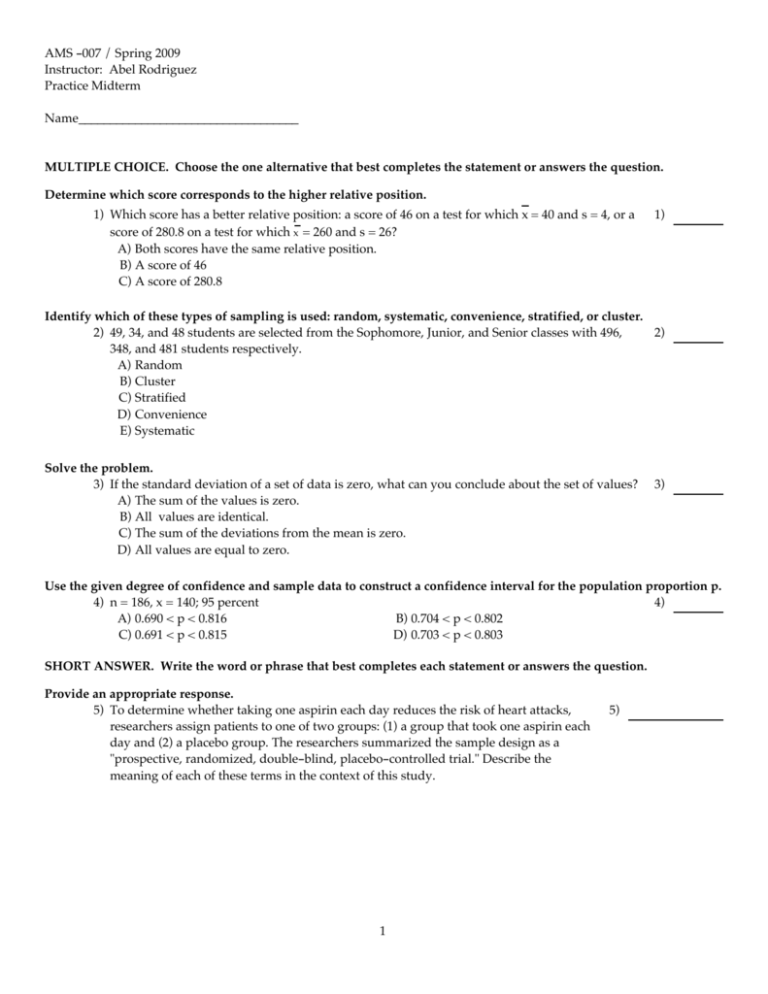
AMS -007 / Spring 2009 Instructor: Abel Rodriguez Practice Midterm Name___________________________________ MULTIPLE CHOICE. Choose the one alternative that best completes the statement or answers the question. Determine which score corresponds to the higher relative position. 1) Which score has a better relative position: a score of 46 on a test for which x = 40 and s = 4, or a score of 280.8 on a test for which x = 260 and s = 26? A) Both scores have the same relative position. B) A score of 46 C) A score of 280.8 1) Identify which of these types of sampling is used: random, systematic, convenience, stratified, or cluster. 2) 49, 34, and 48 students are selected from the Sophomore, Junior, and Senior classes with 496, 2) 348, and 481 students respectively. A) Random B) Cluster C) Stratified D) Convenience E) Systematic Solve the problem. 3) If the standard deviation of a set of data is zero, what can you conclude about the set of values? A) The sum of the values is zero. B) All values are identical. C) The sum of the deviations from the mean is zero. D) All values are equal to zero. 3) Use the given degree of confidence and sample data to construct a confidence interval for the population proportion p. 4) n = 186, x = 140; 95 percent 4) A) 0.690 < p < 0.816 B) 0.704 < p < 0.802 C) 0.691 < p < 0.815 D) 0.703 < p < 0.803 SHORT ANSWER. Write the word or phrase that best completes each statement or answers the question. Provide an appropriate response. 5) To determine whether taking one aspirin each day reduces the risk of heart attacks, researchers assign patients to one of two groups: (1) a group that took one aspirin each day and (2) a placebo group. The researchers summarized the sample design as a "prospective, randomized, double-blind, placebo-controlled trial." Describe the meaning of each of these terms in the context of this study. 1 5) Use Bayes' Theorem to find the indicated probability. 6) A survey conducted in one U.S. city together with information from the census bureau yielded the following table. The first two columns give a percentage distribution of adults in the city by ethnic group. The third column gives the percentage of people in each ethnic group who have health insurance. Ethnic Group Caucasian African American Hispanic Asian Other Percentage of adults 40.8 10.2 16.6 12.8 19.6 6) Percentage with health insurance 74 45 51 64 51 An adult is selected at random from the city. Determine the probability that the adult obtained is Asian given that he or she has health insurance. Find the indicated probability. 7) The participants in a television quiz show are picked from a large pool of applicants with approximately equal numbers of men and women. Among the last 10 participants there have been only 2 women. If participants are picked randomly, what is the probability of getting 2 or fewer women when 10 people are picked? Do you think that this provides evidence of discrimination against women in the selection process? Use the Poisson Distribution to find the indicated probability. 8) The number of calls received by a car towing service averages 12 per day (per 24-hour period). After finding the mean number of calls per hour, find the probability that in a randomly selected hour the number of calls is at least 2. Solve the problem. 9) Human body temperatures are normally distributed with a mean of 98.20eF and a standard deviation of 0.62eF. If 19 people are randomly selected, find the probability that their mean body temperature will be less than 98.50eF. Provide an appropriate response. 10) A hospital staff member recorded the weights (in pounds) of 15 babies born in January: 5.5 6.0 7.2 8.1 9.0 5.6 8.1 7.4 7.3 6.8 4.9 9.2 6.6 7.5 6.9 The staff member also recorded the weights (in pounds) of 15 babies born in February: 8.9 5.6 4.9 5.5 6.6 8.4 7.5 9.2 6.8 5.9 7.2 7.9 6.0 8.0 7.6 Find the five number summaries and construct boxplots. Are there any apparent differences? 2 7) 8) 9) 10) Answer Key Testname: MIDETERM1 1) 2) 3) 4) 5) 6) 7) 8) 9) 10) B C B C Prospective: Data is collected in the future from groups that either did or did not get one aspirin each day. Randomized: Patients were randomly assigned to one of the 2 groups. Double-blind: Neither the patients or the researchers knew who was given aspirin. Placebo-controlled: A placebo group was used as a baseline to compare the aspirin group with. 0.133 0.0547 0.07582 0.9826 The weights recorded for the months of January and February are nearly identical. 3
