VST Tillers Tractors (VSTTIL)
advertisement
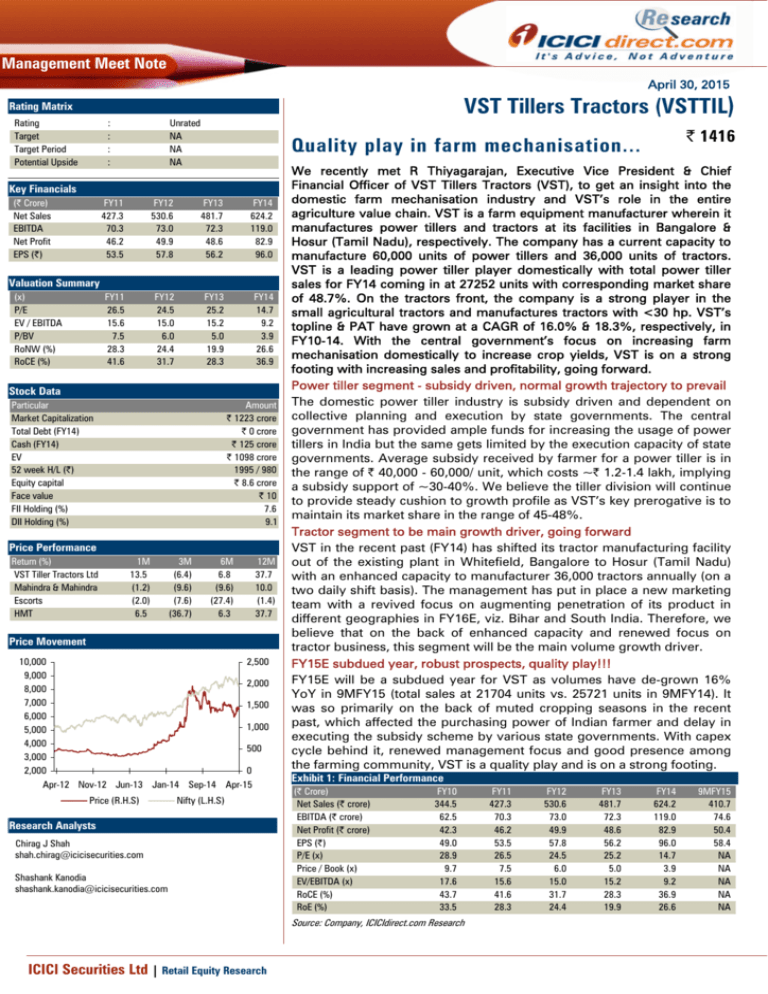
Management Meet Note April 30, 2015 VST Tillers Tractors (VSTTIL) Rating Matrix Rating Target Target Period Potential Upside : : : : Unrated NA NA NA Key Financials (| Crore) Net Sales EBITDA Net Profit EPS (|) FY11 427.3 70.3 46.2 53.5 FY12 530.6 73.0 49.9 57.8 FY13 481.7 72.3 48.6 56.2 FY14 624.2 119.0 82.9 96.0 FY11 26.5 15.6 7.5 28.3 41.6 FY12 24.5 15.0 6.0 24.4 31.7 FY13 25.2 15.2 5.0 19.9 28.3 FY14 14.7 9.2 3.9 26.6 36.9 Valuation Summary (x) P/E EV / EBITDA P/BV RoNW (%) RoCE (%) Stock Data Particular Market Capitalization Total Debt (FY14) Cash (FY14) EV 52 week H/L (|) Equity capital Face value FII Holding (%) DII Holding (%) Amount | 1223 crore | 0 crore | 125 crore | 1098 crore 1995 / 980 | 8.6 crore | 10 7.6 9.1 Price Performance Return (%) VST Tiller Tractors Ltd Mahindra & Mahindra Escorts HMT 1M 13.5 (1.2) (2.0) 6.5 3M (6.4) (9.6) (7.6) (36.7) 6M 6.8 (9.6) (27.4) 6.3 12M 37.7 10.0 (1.4) 37.7 Price Movement 10,000 9,000 8,000 7,000 6,000 5,000 4,000 3,000 2,000 2,500 2,000 1,500 1,000 500 0 Apr-12 Nov-12 Jun-13 Jan-14 Sep-14 Apr-15 Price (R.H.S) | 1416 Quality play in farm mechanisation... Nifty (L.H.S) Research Analysts Chirag J Shah shah.chirag@icicisecurities.com Shashank Kanodia shashank.kanodia@icicisecurities.com We recently met R Thiyagarajan, Executive Vice President & Chief Financial Officer of VST Tillers Tractors (VST), to get an insight into the domestic farm mechanisation industry and VST’s role in the entire agriculture value chain. VST is a farm equipment manufacturer wherein it manufactures power tillers and tractors at its facilities in Bangalore & Hosur (Tamil Nadu), respectively. The company has a current capacity to manufacture 60,000 units of power tillers and 36,000 units of tractors. VST is a leading power tiller player domestically with total power tiller sales for FY14 coming in at 27252 units with corresponding market share of 48.7%. On the tractors front, the company is a strong player in the small agricultural tractors and manufactures tractors with <30 hp. VST’s topline & PAT have grown at a CAGR of 16.0% & 18.3%, respectively, in FY10-14. With the central government’s focus on increasing farm mechanisation domestically to increase crop yields, VST is on a strong footing with increasing sales and profitability, going forward. Power tiller segment - subsidy driven, normal growth trajectory to prevail The domestic power tiller industry is subsidy driven and dependent on collective planning and execution by state governments. The central government has provided ample funds for increasing the usage of power tillers in India but the same gets limited by the execution capacity of state governments. Average subsidy received by farmer for a power tiller is in the range of | 40,000 - 60,000/ unit, which costs ~| 1.2-1.4 lakh, implying a subsidy support of ~30-40%. We believe the tiller division will continue to provide steady cushion to growth profile as VST’s key prerogative is to maintain its market share in the range of 45-48%. Tractor segment to be main growth driver, going forward VST in the recent past (FY14) has shifted its tractor manufacturing facility out of the existing plant in Whitefield, Bangalore to Hosur (Tamil Nadu) with an enhanced capacity to manufacturer 36,000 tractors annually (on a two daily shift basis). The management has put in place a new marketing team with a revived focus on augmenting penetration of its product in different geographies in FY16E, viz. Bihar and South India. Therefore, we believe that on the back of enhanced capacity and renewed focus on tractor business, this segment will be the main volume growth driver. FY15E subdued year, robust prospects, quality play!!! FY15E will be a subdued year for VST as volumes have de-grown 16% YoY in 9MFY15 (total sales at 21704 units vs. 25721 units in 9MFY14). It was so primarily on the back of muted cropping seasons in the recent past, which affected the purchasing power of Indian farmer and delay in executing the subsidy scheme by various state governments. With capex cycle behind it, renewed management focus and good presence among the farming community, VST is a quality play and is on a strong footing. Exhibit 1: Financial Performance (| Crore) Net Sales (| crore) EBITDA (| crore) Net Profit (| crore) EPS (|) P/E (x) Price / Book (x) EV/EBITDA (x) RoCE (%) RoE (%) FY10 344.5 62.5 42.3 49.0 28.9 9.7 17.6 43.7 33.5 Source: Company, ICICIdirect.com Research ICICI Securities Ltd | Retail Equity Research FY11 427.3 70.3 46.2 53.5 26.5 7.5 15.6 41.6 28.3 FY12 530.6 73.0 49.9 57.8 24.5 6.0 15.0 31.7 24.4 FY13 481.7 72.3 48.6 56.2 25.2 5.0 15.2 28.3 19.9 FY14 624.2 119.0 82.9 96.0 14.7 3.9 9.2 36.9 26.6 9MFY15 410.7 74.6 50.4 58.4 NA NA NA NA NA Key financials Revenues at VST have grown at 16.0% CAGR in FY10-14 to | 624 crore in FY14 (| 345 crore in FY10) primarily on the back of increased focus of the central government on an increase in farm mechanisation domestically. Exhibit 2: Revenue trend; grows at CAGR of 16.0% in FY10-14 700 600 531 500 | crore 9MFY14: 462 crore 624 482 427 411 345 400 300 200 100 - FY10 FY11 FY12 FY13 FY14 9MFY15 Source: Company, ICICIdirect.com Research As of FY14, power tillers are the main revenue contributor for VST (share at ~55%) with other contributors being tractors (~30%), rice transplanters (~2%), spare parts and others. Exhibit 3: Revenue bifurcation (FY14) others, | 31 crore, 5% Spares, | 42 crore, 7% It should be noted that VST only manufacturers power tillers and tractors. Rice transplanters are something that it does not manufacturer but trades. The company imports the same from various vendors based out of China and Japan and sells the same in India Rice Transplanter, | 13 crore, 2% Power Tiller, | 342 crore, 55% Tractor, | 194 crore, 31% Source: Company, ICICIdirect.com Research 130000 125661 8000 7000 100000 FY10 FY11 FY12 Sales Volume FY13 FY14 9MFY15 Realization Source: Company, ICICIdirect.com Research ICICI Securities Ltd | Retail Equity Research 221309 7452 240000 230000 5087 215806 234498 6233 3000 1000 0 7038 4000 2000 250000 247634 5000 4735 |/unit 16617 27252 21231 110000 260000 6000 number of units 120000 115099 26154 10000 23449 113834 111181 19068 number of units 122764 20000 270000 260682 3758 30000 Exhibit 5: Tractor sales volume & realisation trend 220000 210000 0 200000 FY10 FY11 FY12 Sales Volume FY13 FY14 9MFY15 Realization Source: Company, ICICIdirect.com Research Page 2 |/unit Exhibit 4: Power tillers sales volume & realisation trend Power tillers sales volume have grown at a CAGR of 9.3% in FY10-14 to 27252 units (FY14) while realisation has grown at a CAGR of 3.1% to | 125661/unit (FY14). On the tractors front, sales volume have grown at a CAGR of 18.7% in FY10-14 to 7452 units (FY14) while realisations have grown at a CAGR of 4.8% in FY10-14 to | 260682/unit (FY14). Exhibit 6: Market share in power tiller segment domestically 50000 FY12 56000 44 42 27252 FY11 47000 FY10 43.6 21231 FY09 60000 FY08 55100 FY07 42.4 42.6 26154 0 38794 19068 10000 35294 16691 20000 26135 12174 30000 48 46 45.2 23449 40000 48.7 47.3 46.6 24791 10501 number of units VST has always maintained its market leadership in the power tiller segment domestically with market share in the range of 42%-48%. The other major players are Kamco (~25%) & Chinese companies (~25%-30%) 50 49.2 % 60000 40 38 Total Industry Sales VST Sales FY13 FY14 Market Share Source: Company, ICICIdirect.com Research Exhibit 7: EBITDA & EBITDA margins trend Exhibit 8: RoCE & RoE trend 25 140 18.1 16.4 13.8 18.2 15.0 20 70 20 60 50 % 119 75 10 72 73 70 60 40 80 15 80 63 | crore 100 19.1 % 120 20 FY10 FY11 FY12 EBITDA (| crore) FY13 FY14 54.1 43.7 44.0 41.6 33.5 28.3 36.9 36.9 28.3 31.7 24.4 10 - - 67.8 40 30 5 69.6 26.6 19.9 - 9MFY15 FY10 EBITDA Margin (%) FY11 FY12 RoCE (%) FY13 RoE (%) FY14 RoIC (%) Source: Company, ICICIdirect.com Research Source: Company, ICICIdirect.com Research Exhibit 9: PAT trend; grows at CAGR of 18.3% in FY10-14 90 83 80 9MFY14: 58 crore 70 | crore 60 50 42 46 50 49 FY12 FY13 50 40 30 20 10 FY10 FY11 FY14 9MFY15 Source: Company, ICICIdirect.com Research ICICI Securities Ltd | Retail Equity Research Page 3 Exhibit 10: Product Profile Power Tillers It is a versatile machine which carries out all the function of tractor except that the operator has to walk behind the machine. Ideally suited for small farmers with popular usage are wet puddling, dry land cultivation, ridging, water pumping and spraying Mitsubishi Shakti VWH 120 Power Tiller (Power 9 hp) VST Shakti 130 DI Power Tiller (13 hp) Dragon Shakti 150 DI Power Tiller (15 hp) Tractors The state of art technology of Mitsubishi, very low weight and in built rotary find exclusive application in wet puddling, inter cultivation, spraying for all crops and horticulture requiring less than 5 feet of row width planting. VST Mitsubishi Shakti VT 224 -1D (22 hp) Mitsubishi Shakti MT 180D Tractor (18.5 hp) VST Mitsubishi Shakti VT 224 - 1D AJAI - 4WB (22 hp) Other farm equipments which are not manufactured but traded upon are: Rice Transplanter & Power Reaper VST is the pioneer in introduction and leader in mechanized rice transplanter. VST deals with both 8 row ridding and 6 row walk behind rice transplanter. VST, Power Reapers are mechanised units powered by a light weight diesel engine which assist in harvesting rice, wheat, barley etc with rotating blades. VST Yanji Shakti 8 Row Paddy Transplanter VST Shakti VS-4PR(n) Power Reaper Source: Company, ICICIdirect.com Research ICICI Securities Ltd | Retail Equity Research Page 4 RATING RATIONALE ICICIdirect.com endeavours to provide objective opinions and recommendations. ICICIdirect.com assigns ratings to its stocks according to their notional target price vs. current market price and then categorises them as Strong Buy, Buy, Hold and Sell. The performance horizon is two years unless specified and the notional target price is defined as the analysts' valuation for a stock. Strong Buy: >15%/20% for large caps/midcaps, respectively, with high conviction; Buy: >10%/15% for large caps/midcaps, respectively; Hold: Up to +/-10%; Sell: -10% or more; Pankaj Pandey Head – Research pankaj.pandey@icicisecurities.com ICICIdirect.com Research Desk, ICICI Securities Limited, 1st Floor, Akruti Trade Centre, Road No. 7, MIDC, Andheri (East) Mumbai – 400 093 research@icicidirect.com ICICI Securities Ltd | Retail Equity Research Page 5 Disclaimer ANALYST CERTIFICATION We /I, Chirag Shah PGDBM; Shashank Kanodia MBA (Capital Markets), Research Analysts, authors and the names subscribed to this report, hereby certify that all of the views expressed in this research report accurately reflect our views about the subject issuer(s) or securities. We also certify that no part of our compensation was, is, or will be directly or indirectly related to the specific recommendation(s) or view(s) in this report. Terms & conditions and other disclosures: ICICI Securities Limited (ICICI Securities) is a full-service, integrated investment banking and is, inter alia, engaged in the business of stock brokering and distribution of financial products. ICICI Securities is a wholly-owned subsidiary of ICICI Bank which is India’s largest private sector bank and has its various subsidiaries engaged in businesses of housing finance, asset management, life insurance, general insurance, venture capital fund management, etc. (“associates”), the details in respect of which are available on www.icicibank.com. ICICI Securities is one of the leading merchant bankers/ underwriters of securities and participate in virtually all securities trading markets in India. We and our associates might have investment banking and other business relationship with a significant percentage of companies covered by our Investment Research Department. ICICI Securities generally prohibits its analysts, persons reporting to analysts and their relatives from maintaining a financial interest in the securities or derivatives of any companies that the analysts cover. The information and opinions in this report have been prepared by ICICI Securities and are subject to change without any notice. The report and information contained herein is strictly confidential and meant solely for the selected recipient and may not be altered in any way, transmitted to, copied or distributed, in part or in whole, to any other person or to the media or reproduced in any form, without prior written consent of ICICI Securities. While we would endeavour to update the information herein on a reasonable basis, ICICI Securities is under no obligation to update or keep the information current. Also, there may be regulatory, compliance or other reasons that may prevent ICICI Securities from doing so. Non-rated securities indicate that rating on a particular security has been suspended temporarily and such suspension is in compliance with applicable regulations and/or ICICI Securities policies, in circumstances where ICICI Securities might be acting in an advisory capacity to this company, or in certain other circumstances. This report is based on information obtained from public sources and sources believed to be reliable, but no independent verification has been made nor is its accuracy or completeness guaranteed. This report and information herein is solely for informational purpose and shall not be used or considered as an offer document or solicitation of offer to buy or sell or subscribe for securities or other financial instruments. Though disseminated to all the customers simultaneously, not all customers may receive this report at the same time. ICICI Securities will not treat recipients as customers by virtue of their receiving this report. Nothing in this report constitutes investment, legal, accounting and tax advice or a representation that any investment or strategy is suitable or appropriate to your specific circumstances. The securities discussed and opinions expressed in this report may not be suitable for all investors, who must make their own investment decisions, based on their own investment objectives, financial positions and needs of specific recipient. This may not be taken in substitution for the exercise of independent judgment by any recipient. The recipient should independently evaluate the investment risks. The value and return on investment may vary because of changes in interest rates, foreign exchange rates or any other reason. ICICI Securities accepts no liabilities whatsoever for any loss or damage of any kind arising out of the use of this report. Past performance is not necessarily a guide to future performance. Investors are advised to see Risk Disclosure Document to understand the risks associated before investing in the securities markets. Actual results may differ materially from those set forth in projections. Forward-looking statements are not predictions and may be subject to change without notice. ICICI Securities or its associates might have managed or co-managed public offering of securities for the subject company or might have been mandated by the subject company for any other assignment in the past twelve months. ICICI Securities or its associates might have received any compensation from the companies mentioned in the report during the period preceding twelve months from the date of this report for services in respect of managing or co-managing public offerings, corporate finance, investment banking or merchant banking, brokerage services or other advisory service in a merger or specific transaction. ICICI Securities or its associates might have received any compensation for products or services other than investment banking or merchant banking or brokerage services from the companies mentioned in the report in the past twelve months. ICICI Securities encourages independence in research report preparation and strives to minimize conflict in preparation of research report. ICICI Securities or its analysts did not receive any compensation or other benefits from the companies mentioned in the report or third party in connection with preparation of the research report. Accordingly, neither ICICI Securities nor Research Analysts have any material conflict of interest at the time of publication of this report. It is confirmed that Chirag Shah PGDBM; Shashank Kanodia MBA (Capital Markets), Research Analysts of this report have not received any compensation from the companies mentioned in the report in the preceding twelve months. Compensation of our Research Analysts is not based on any specific merchant banking, investment banking or brokerage service transactions. ICICI Securities or its subsidiaries collectively or Research Analysts do not own 1% or more of the equity securities of the Company mentioned in the report as of the last day of the month preceding the publication of the research report. Since associates of ICICI Securities are engaged in various financial service businesses, they might have financial interests or beneficial ownership in various companies including the subject company/companies mentioned in this report. It is confirmed that Chirag Shah PGDBM; Shashank Kanodia MBA (Capital Markets), Research Analysts do not serve as an officer, director or employee of the companies mentioned in the report. ICICI Securities may have issued other reports that are inconsistent with and reach different conclusion from the information presented in this report. Neither the Research Analysts nor ICICI Securities have been engaged in market making activity for the companies mentioned in the report. We submit that no material disciplinary action has been taken on ICICI Securities by any Regulatory Authority impacting Equity Research Analysis activities. This report is not directed or intended for distribution to, or use by, any person or entity who is a citizen or resident of or located in any locality, state, country or other jurisdiction, where such distribution, publication, availability or use would be contrary to law, regulation or which would subject ICICI Securities and affiliates to any registration or licensing requirement within such jurisdiction. The securities described herein may or may not be eligible for sale in all jurisdictions or to certain category of investors. Persons in whose possession this document may come are required to inform themselves of and to observe such restriction. ICICI Securities Ltd | Retail Equity Research Page 6
