N. Gregory Mankiw – Principles of Economics Chapter 9
advertisement
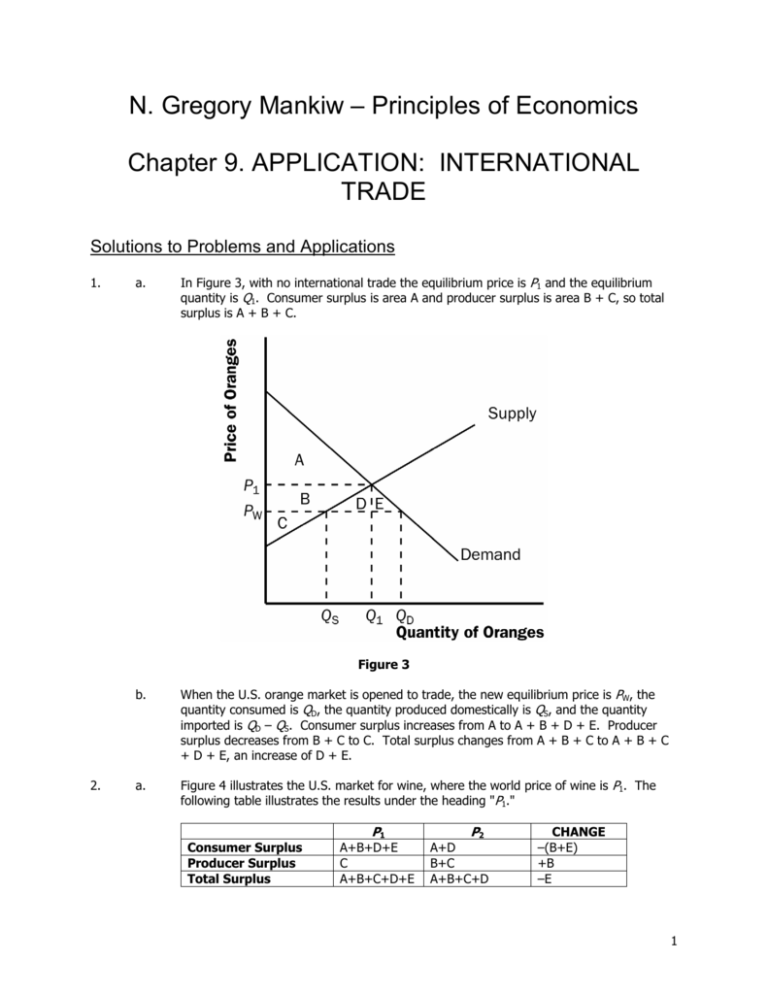
N. Gregory Mankiw – Principles of Economics Chapter 9. APPLICATION: INTERNATIONAL TRADE Solutions to Problems and Applications 1. a. In Figure 3, with no international trade the equilibrium price is P1 and the equilibrium quantity is Q1. Consumer surplus is area A and producer surplus is area B + C, so total surplus is A + B + C. Figure 3 2. b. When the U.S. orange market is opened to trade, the new equilibrium price is PW, the quantity consumed is QD, the quantity produced domestically is QS, and the quantity imported is QD – QS. Consumer surplus increases from A to A + B + D + E. Producer surplus decreases from B + C to C. Total surplus changes from A + B + C to A + B + C + D + E, an increase of D + E. a. Figure 4 illustrates the U.S. market for wine, where the world price of wine is P1. The following table illustrates the results under the heading "P1." Consumer Surplus Producer Surplus Total Surplus P1 A+B+D+E C A+B+C+D+E P2 A+D B+C A+B+C+D CHANGE –(B+E) +B –E 1 Chapter 9 Figure 4 b. 3. The shift in the Gulf Stream destroys some of the grape harvest, raising the world price of wine to P2. The table shows the effects on consumer, producer, and total surplus, under the heading "P2" and the change in the surplus measures under the heading "CHANGE." Consumers lose, producers win, and the United States as a whole is worse off. Figure 5 shows the market for cotton in countries A and B. Note that the world price of cotton is the same in both countries. Country A imports cotton from country B. The table below shows that total surplus is higher in both countries. However, in country A, consumers are better off and producers are worse off, while in country B, consumers are worse off and producers are better off. Chapter 9 Figure 5 4. Consumer Surplus Producer Surplus Total Surplus COUNTRY A Before Trade After Trade C C+D+F D+E E C+D+E C+D+E+F CHANGE +(D+F) –D +F Consumer Surplus Producer Surplus Total Surplus COUNTRY B Before Trade After Trade G+H G I H+I+J G+H+I G+H+I+J CHANGE –H +(H+J) +J The impact of a tariff on imported autos is shown in Figure 6. Without the tariff, the price of an auto is PW, the quantity produced in the United States is Q1S, and the quantity purchased in the United States is Q1D. The United States imports Q1D – Q1S autos. The imposition of the tariff raises the price of autos to PW + t, causing an increase in quantity supplied by U.S. producers to Q2S and a decline in the quantity demanded to Q2D, thus reducing the number of imports to Q2D – Q2S. The table shows the impact on consumer surplus, producer surplus, government revenue, and total surplus both before (OLD) and after (NEW) the imposition of the tariff, as well as the change (CHANGE). Since consumer surplus declines by C+D+E+F while producer surplus rises by C and government revenue rises by E, the deadweight loss is D+F. The loss of consumer surplus in the amount C+D+E+F is split up as follows: C goes to producers, E goes to the government, and D+F is deadweight loss. Figure 6 Chapter 9 Consumer Surplus Producer Surplus Government Revenue Total Surplus 5. Before Tariff A+B+C+D+E+F G 0 A+B+C+D+E+F+G After Tariff A+B C+G E A+B+C+E+G CHANGE –(C+D+E+F) +C +E –(D+F) a. The world wheat price must be below the U.S. no-trade price, because wheat farmers oppose NAFTA. They oppose it because they know that when trade is allowed, the U.S. price of wheat will decline to the world price, and their producer surplus will fall. The world corn price must be above the U.S. no-trade price, since corn farmers support NAFTA. They know that when trade is allowed, the U.S. price of corn will rise to the world price, and their producer surplus will rise. b. Considering both markets together, NAFTA makes wheat farmers worse off and corn farmers better off, so it isn't clear whether farmers as a whole gain or lose. Similarly, consumers of wheat gain (since the price of wheat will decline) and consumers of corn lose (since the price of corn will rise), so consumers as a whole may either gain or lose. However, we know that the total gains from trade are positive, so the United States as a whole is better off. 6. The tax on wine from California is just like a tariff imposed by one country on imports from another. As a result, Washington producers would be better off and Washington consumers would be worse off. The higher price of wine in Washington means producers would produce more wine, so they would hire more workers. Tax revenue would go to the government of Washington. So both claims are true, but it is a bad policy because the losses to Washington consumers exceed the gains to producers. 7. Senator Hollings is correct that the price of clothing is the world price. When trade is allowed, the domestic price of clothing is driven to the world price. The price is lower than it would be in the absence of trade, so consumer surplus is higher than it would be without trade and this means that consumers do benefit from lower-priced imports. 8. a. In support of the policy that the government should not allow imports if foreign firms are selling below their costs of production (dumping), you could argue that dumping is an attempt to drive domestic producers out of business, after which the foreign firms would have a monopoly position and raise their prices. Criticism of this policy could include the argument that if foreign governments want to subsidize our consumption by selling goods to us below their cost of production, we benefit and they lose, so that is a good thing for us. The argument about gaining monopoly power isn’t an issue if the costs of new firms entering the industry is low. The dumping argument is often used by domestic firms when foreign firms have a comparative advantage in that industry, so protecting them reduces social welfare. b. In support of the policy that the government should temporarily stop the import of goods for which the domestic industry is new and struggling to survive, you could argue that once the domestic industry gets going it will be able to be profitable and compete with foreign firms. But criticism of the policy could include the arguments that the government would have to pick which industries might survive in the future (something the government is not likely to be good at doing, since it is likely to be determined politically), such protection is hard to remove in the future, and because the private sector itself can take care of infant industries by giving them capital even as they are Chapter 9 starting out. Again, this type of policy is often proposed by domestic firms in industries for which foreign firms have a comparative advantage, so protecting them reduces social welfare. 9. c. In support of the policy that the government should not allow imports from countries with weaker environmental regulations than ours, you could argue that such a policy can be used as a bargaining chip to force other countries to improve their environments, thus improving social welfare. But criticism of the policy might argue that if the threat does not work, then social welfare will be reduced because trade will be lower. a. When a technological advance lowers the world price of televisions, the effect on the United States, an importer of televisions, is shown in Figure 7. Initially the world price of televisions is P1, consumer surplus is A + B, producer surplus is C + E, total surplus is A + B + C + E, and the amount of imports is shown as “Imports1”. After the improvement in technology, the world price of televisions declines to P2, consumer surplus increases by C + D to A + B + C + D, producer surplus declines by C to E, total surplus rises by D to A + B + C + D + E, and the amount of imports rises to “Imports2”. Figure 7 b. If the United States has a binding quota on television imports, the situation is shown in Figure 8. In this situation, both before and after the technological advance, the quantity of televisions demanded is QqD and the quantity produced domestically is QqS. Thus consumer surplus and producer surplus are unaffected by the productivity improvement. However, the license holders initially received E’ + E’’ but now they also get area I. Total surplus also increases by I. However, if there were no quota, total welfare would be higher by D + F before the technological advance and an additional H’ + H’’ + J after the advance. Chapter 9 Figure 8 10. Selling the licenses at auction is the policy with the lowest deadweight loss, since the licenses go to those who value them the most. In addition, the government gets revenue from selling the licenses, so it can reduce taxes elsewhere, lowering deadweight loss from other taxes. The largest deadweight loss probably goes to the policy of waiting in line for the licenses, since people incur the loss of time in waiting, which is a deadweight loss. If people can then sell the licenses, they'll go to those who value them most highly; however, the government will get no revenue, and will not be able to reduce taxes elsewhere. The policy with the middle amount of deadweight loss is the policy of distributing licenses randomly. It does not have the deadweight loss associated with people standing in line, but does not raise revenue like the policy of selling the licenses. 11. a. Figure 9 illustrates the effects of a quota in the U.S. sugar market. The domestic supply curve is denoted S. If there were no quota, the total supply curve would be along curve S for quantities from 0 to Q1S (representing domestic production) and would be horizontal at PW (the world price of sugar) for higher quantities, representing imports of sugar. The result is that the equilibrium quantity supplied by domestic producers is Q1S, the equilibrium quantity demanded is Q1D, imports are Q1D – Q1S, and the price is PW. When the quota is introduced, the total supply curve is the same as without the quota up to the quantity Q1S + quota, then follows the curve S + quota for higher quantities. The quota limits the quantity of imports of sugar, leading to equilibrium at price Pq. The result is that the equilibrium quantity supplied by domestic producers is Q2S, the equilibrium quantity demanded is Q2D, and imports are Q2D – Q2S, which equals the quota. Chapter 9 Figure 9 b. The following table illustrates the effects of the quota on sugar on welfare. The gains to license-holders may accrue to private parties if the government gives the quota licenses away, or to the government if the licenses are sold. Consumer Surplus Producer Surplus License Holders Total Surplus 12. Without Quota A+B+C+D+E'+E"+F G 0 A+B+C+D+E'+E"+F+G With Quota A+B C+G E'+E" A+B+C+E'+E"+G CHANGE -(C+D+E'+E"+F) +C +E'+E" -(D+F) c. Gains and losses in other countries could be important, since trade can improve the welfare of all nations. In addition, it is not clear that we should be in cutthroat competition with other countries; we may care about people throughout the world. d. The higher sugar prices caused by the quota system have had an impact on the fructose syrup industry since fructose is a substitute for sugar. With a higher sugar price, people substitute fructose for sugar, so the fructose industry expands. An export subsidy increases the price of steel exports received by producers by the amount of the subsidy, s, as shown in Figure 10. The figure shows the world price, PW, before the subsidy is put in place. At that price, domestic consumers buy quantity Q1D of steel, producers supply Q1S units, and the country exports the quantity Q1S – Q1D. With the subsidy put in place, suppliers get a total price per unit of PW + s, since they receive the world price for their exports PW, and the government pays them the subsidy of s. However, note that domestic consumers can still buy steel at the world price PW, by importing it. Domestic firms don't want to sell steel to domestic customers, since they don't get the subsidy for doing so. So domestic companies will sell all the steel they produce abroad, in total quantity Q2S. Domestic consumers continue to buy quantity Q1D. The country imports steel in quantity Q1D and exports the quantity Q2S, so net exports of steel are the quantity Q2S – Q1D. The end result is that the domestic price of steel is unchanged, the quantity of steel produced increases, the quantity of steel consumed is Chapter 9 unchanged, and the quantity of steel exported increases. As the following table shows, consumer surplus is unaffected, producer surplus rises, government revenue declines, and total surplus declines. Figure 10 Consumer Surplus Producer Surplus Government Revenue Total Surplus Without Subsidy A+B E+F+G 0 A+B+E+F+G With Subsidy A+B B+C+E+F+G –(B+C+D) A+B–D+E+F+G CHANGE 0 +(B+C) –(B+C+D) –D

