PT UNILEVER INDONESIA TBK
advertisement
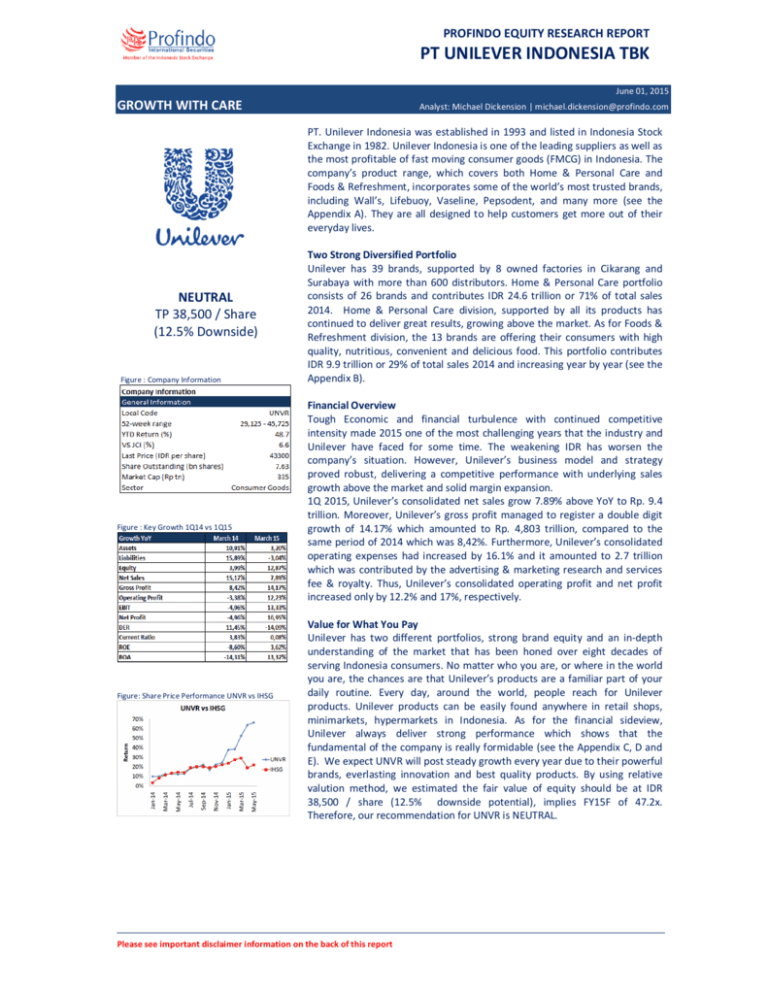
PROFINDO EQUITY RESEARCH REPORT PT UNILEVER INDONESIA TBK June 01, 2015 GROWTH WITH CARE Analyst: Michael Dickension | michael.dickension@profindo.com PT. Unilever Indonesia was established in 1993 and listed in Indonesia Stock Exchange in 1982. Unilever Indonesia is one of the leading suppliers as well as the most profitable of fast moving consumer goods (FMCG) in Indonesia. The company’s product range, which covers both Home & Personal Care and Foods & Refreshment, incorporates some of the world’s most trusted brands, including Wall’s, Lifebuoy, Vaseline, Pepsodent, and many more (see the Appendix A). They are all designed to help customers get more out of their everyday lives. NEUTRAL TP 38,500 / Share (12.5% Downside) Figure : Company Information Figure : Key Growth 1Q14 vs 1Q15 Figure: Share Price Performance UNVR vs IHSG Two Strong Diversified Portfolio Unilever has 39 brands, supported by 8 owned factories in Cikarang and Surabaya with more than 600 distributors. Home & Personal Care portfolio consists of 26 brands and contributes IDR 24.6 trillion or 71% of total sales 2014. Home & Personal Care division, supported by all its products has continued to deliver great results, growing above the market. As for Foods & Refreshment division, the 13 brands are offering their consumers with high quality, nutritious, convenient and delicious food. This portfolio contributes IDR 9.9 trillion or 29% of total sales 2014 and increasing year by year (see the Appendix B). Financial Overview Tough Economic and financial turbulence with continued competitive intensity made 2015 one of the most challenging years that the industry and Unilever have faced for some time. The weakening IDR has worsen the company’s situation. However, Unilever’s business model and strategy proved robust, delivering a competitive performance with underlying sales growth above the market and solid margin expansion. 1Q 2015, Unilever’s consolidated net sales grow 7.89% above YoY to Rp. 9.4 trillion. Moreover, Unilever’s gross profit managed to register a double digit growth of 14.17% which amounted to Rp. 4,803 trillion, compared to the same period of 2014 which was 8,42%. Furthermore, Unilever’s consolidated operating expenses had increased by 16.1% and it amounted to 2.7 trillion which was contributed by the advertising & marketing research and services fee & royalty. Thus, Unilever’s consolidated operating profit and net profit increased only by 12.2% and 17%, respectively. Value for What You Pay Unilever has two different portfolios, strong brand equity and an in-depth understanding of the market that has been honed over eight decades of serving Indonesia consumers. No matter who you are, or where in the world you are, the chances are that Unilever’s products are a familiar part of your daily routine. Every day, around the world, people reach for Unilever products. Unilever products can be easily found anywhere in retail shops, minimarkets, hypermarkets in Indonesia. As for the financial sideview, Unilever always deliver strong performance which shows that the fundamental of the company is really formidable (see the Appendix C, D and E). We expect UNVR will post steady growth every year due to their powerful brands, everlasting innovation and best quality products. By using relative valution method, we estimated the fair value of equity should be at IDR 38,500 / share (12.5% downside potential), implies FY15F of 47.2x. Therefore, our recommendation for UNVR is NEUTRAL. Please see important disclaimer information on the back of this report PROFINDO EQUITY RESEARCH REPORT PT UNILEVER INDONESIA TBK Appendix A : Company Shareholders and Portfolio Appendix B : Portfolio Contributions for the Company Please see the important disclaimer information on the back of this report P a g e |2 PROFINDO EQUITY RESEARCH REPORT PT UNILEVER INDONESIA TBK Appendix C. Balance Sheet Please see the important disclaimer information on the back of this report P a g e |3 PROFINDO EQUITY RESEARCH REPORT PT UNILEVER INDONESIA TBK Appendix D. Income Statement Appendix E. Ratios Please see the important disclaimer information on the back of this report P a g e |4 PROFINDO EQUITY RESEARCH REPORT PT UNILEVER INDONESIA TBK KANTOR PUSAT KANTOR CABANG BANDUNG http://www.profindo.com Gedung Permata Kuningan, Lt. 19 Jl. Kuningan Mulia, Kav. 9C, Guntur Setiabudi Jakarta Selatan 12980 Phone : +62 21 8378 0888 Fax : +62 21 8378 0889 Jl. Sunda No. 50B Bandung, Jawa Barat Phone : +62 22 420 2678 Fax : +62 22 420 2676 EMAIL : bayu.cahyadi@profindo.com michael.dickension@profindo.com DISCLAIMER This research report is prepared by PT PROFINDO INTERNATIONAL SECURITIES for information purposes only and is not to be used or considered as an offer or the solicitation of an offer to sell or to buy or subscribe for securities or other financial instruments. The report has been prepared without regard to individual financial circumstance, need or objective of person to receive it. The securities discussed in this report may not be suitable for all investors. The appropriateness of any particular investment or strategy whether opined on or referred to in this report or otherwise will depend on an investor’s individual circumstance and objective and should be independently evaluated and confirmed by such investor, and, if appropriate, with his professional advisers independently before adoption or implementation (either as is or varied). Please see the important disclaimer information on the back of this report P a g e |5
