Geological Mapping & Remote Image Interpretation
advertisement
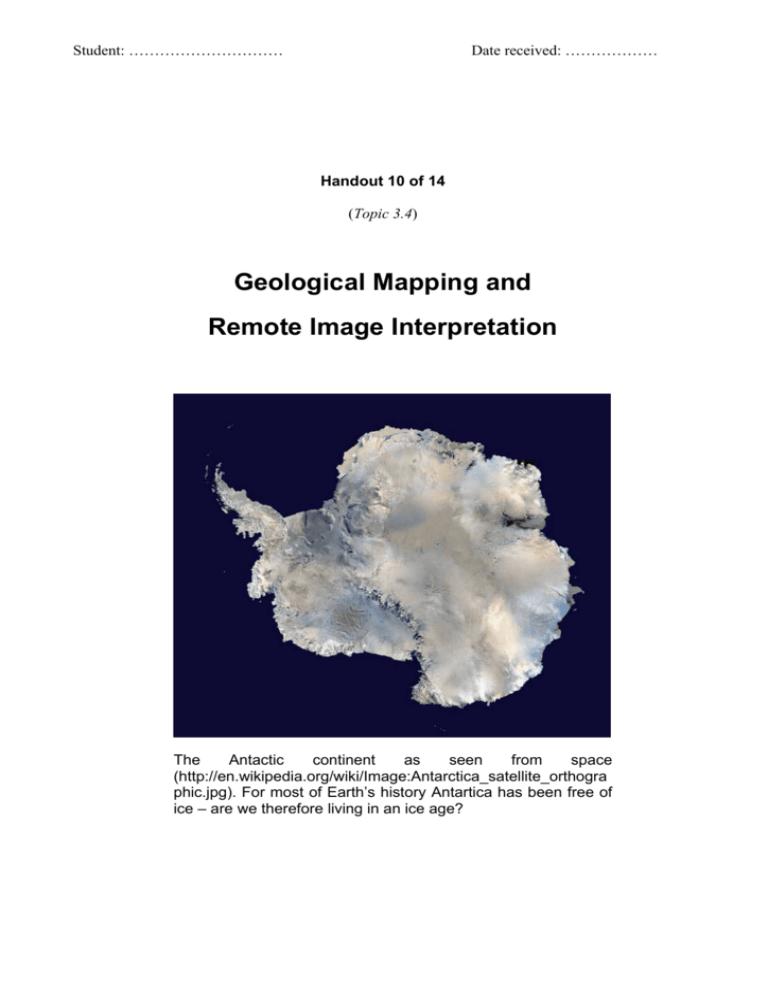
Student: ………………………… Date received: ……………… Handout 10 of 14 (Topic 3.4) Geological Mapping and Remote Image Interpretation The Antactic continent as seen from space (http://en.wikipedia.org/wiki/Image:Antarctica_satellite_orthogra phic.jpg). For most of Earth’s history Antartica has been free of ice – are we therefore living in an ice age? The History of the Earth Geological Mapping & Remote Image Interpretation Key Ideas Geological maps and images provide information about structures and rock types. Intended Student Learning Explain the meanings of the terms ‘dip’ and ‘strike’. Interpret the dip and strike symbols on geological maps. Identify the following structures on geological maps, cross-sectional diagrams, block diagrams, aerial photographs, and satellite images, as appropriate: • • • Normal, reverse, and lateral faults Synclines and anticlines, both nonplunging and plunging The axis of a fold. State the direction of plunge where relevant. Draw block diagrams to illustrate geological structures. Interpret the geological history of an area shown on a geological map, block diagram, or crosssection. Interpret maps, images, or photographs that relate directly to the area studied in the field. Topic 3.4 Geological Mapping & Remote Image Interpretation Page 2 of 27 3.4 – Geological Mapping & Remote Image Interpretation This famous geological feature is in California. What is it? GEOLOGICAL MAPS A geological map is a special-purpose map made for showing subsurface geological features. Geologic maps are often superimposed over a topographic map (and at times over other base maps) with the addition of a color mask with letter symbols to represent the kind of geological unit, fault lines, strike and dip symbols, and various additional symbols (e.g. mine or mineralisation) as indicated by the map key. Geological maps provide a plan view of an area. They are produced by a combination of aerial surveys and on-the-ground mapping. They show rock types appearing at Earth’s surface, as well as the orientation of rock strata. On a geological map you should be able to: • recognise a variety of geological structures, especially faults and plunging or non-plunging folds. • determine age relationships across faults (i.e. say which side of a fault is the down-thrown side). A geological map always has a key, from which you must be able to: • relate the information in the key to the map. • interpret relationships between rock types. • associate hand specimens with rock descriptions. Topic 3.4 Geological Mapping & Remote Image Interpretation Page 3 of 27 Above: Example of a (black & white) generalised geological map of the Adelaide region (Parker 1986, modified after Twidale et al. 1976). Note the symbols used for the respective rock types. Topic 3.4 Geological Mapping & Remote Image Interpretation Page 4 of 27 Source: http://www.soton.ac.uk/~imw/Geology Britain.htm Opposite and above: Two old geological maps, one of Great Britain, the other of Devon. Although these maps from the 1800s are more than 140 years, modern-day equivalents bear remarkable similarity! “…..new frameworks are like climbing a mountain — the larger view encompasses, rather than rejects the earlier more restricted view.” Albert Einstein DIP AND STRIKE Definition The terms dip and strike are used to describe the orientation of rock layers, or strata. The angle of dip is the angle that the strata make with the horizontal. The direction of dip is the compass direction of a vertical line on the strata. The strike is the compass direction of a horizontal line on the strata. Strike must always be compass directions e.g. described in terms of two E-W or NW-SE. Note that the direction perpendicular (at 90˚) to of dip the strike. Topic 3.4 Geological Mapping & Remote Image Interpretation is always Page 5 of 27 Map Symbols for Dip and Strike The symbols used on geological maps to describe the dip and strike of strata are shown in the diagrams below. \ The adjacent diagram shows how the symbols may appear on a geological map. The beds are dipping towards the southwest, and the angle of dip is 60°. Their strike is northwest southeast. You can see that the strike is perpendicular to the direction of dip. Folded Strata The block diagrams below show that on a geological map, synclines and anticlines will show the same rock types either side of the axis of the fold. Topic 3.4 Geological Mapping & Remote Image Interpretation Page 6 of 27 Symmetrical structures are considered normal and therefore are simply called Anticlines or Synclines. Asymmetrical structures are considered special cases and are noted, e.g. asymmetrical anticlines or synclines. Dip symbols will tell you whether the fold is a syncline or an anticline. A symmetrical syncline. The youngest rocks are in the centre. (Dipping inward) A symmetrical anticline. The oldest rocks are in the centre. (Dipping outward) Plunging Folds Plunging folds (either synclines or anticlines) are formed when the axis of a fold is tilted at an angle to the horizontal. Plunging synclines and anticlines may be formed either by folding of tilted strata or by tilting of existing folds. When the upper part of the fold is weathered away, the rock type boundaries form a pattern of loops. Topic 3.4 Geological Mapping & Remote Image Interpretation Page 7 of 27 The angle which the fold axis makes with the horizontal is called the angle of plunge. On a geological map, plunging folds produce patterns of curves. Look for dip symbols to decide whether the fold is a syncline or an anticline. The diagrams below show the symbols used on geological maps for parts of folds. Topic 3.4 Geological Mapping & Remote Image Interpretation Page 8 of 27 Use the following rule to determine the direction of plunge of the fold axis: The direction of plunge is always towards the younger rocks. OR expressed as: Anticlines CLOSE in the direction of their plunge, and Synclines OPEN in the direction of their plunge. This rule is illustrated by the following diagrams: The direction of the dip symbols indicates that this is a plunging syncline. The direction of the dip symbols indicates that this is a plunging anticline. The youngest rocks are in the centre of the fold. The youngest rocks are on the outside of the fold. The fold is therefore plunging to the South. The angle of plunge of the fold axis is 10° The fold is plunging to the North. The angle of plunge of the axis is 5° UNCONFORMITIES Unconformities can be identified on maps where three (or sometimes more) lithologies meet at a point. However, unconformities can also be present where only two lithologies meet. Unconformities should also be indicated in the key to a map. They are often represented on a map as a squiggly line. CROSS-SECTIONS & BLOCK DIAGRAMS Given a cross-sectional diagram or a block diagram, you should be able to: 1. identify rock structures — folds, faults etc. 2. indicate axial planes of folds. 3. recognise unconformities. 4. give the geological history of the area shown. Topic 3.4 Geological Mapping & Remote Image Interpretation Page 9 of 27 TYPES OF GEOLOGICAL MAPS If we want to sho the geology of a large area, e.g. State of South Australia, we need to simplify the all the information to be represented. The map opposite is a map of South Australia’s major geological provinces (very similar to a tectonic sketch map). Source: http://www.pir.sa.gov.au /byteserve/minerals/pdf/ 1craton.pdf Many types of geological maps can now be downloaded from the internet, free of charge. Some of the most important internet sites are: Primary Industries and Resources SA (http://www.pir.sa.gov.au/sector5.shtml) Department of Industry and Resources WA (http://www.doir.wa.gov.au/GSWA/index.asp) Link to Geological Survey/ Maps & Resources) Geoscience Australia (http://www.ga.gov.au/map/images.jsp) Topic 3.4 Geological Mapping & Remote Image Interpretation Page 10 of 27 Above: Magnetic anomaly map of Australia. Visit http://www.ga.gov.au/image_ cache/GA7651.jpg to view a colour version of this map. Modern geological mapping includes magnetic and gravity anomaly maps that have been assembled using sophisticated computer enhancement techniques. These kinds of images are used in conjunction with conventional geological maps by mineral exploration companies AERIAL PHOTOS & SATELLITE IMAGES Aerial Photographs are taken from aircraft, usually flying fairly low above the terrain. They are in either natural colours or black and white. They show the topography of the area in the photograph, and possibly give some indication of the nature of the vegetation. Satellite Images, as the name implies, are taken from satellites above Earth’s atmosphere. Therefore they cover a much larger area than conventional aerial photographs, but may show less detail. However, many topographic features can still be identified on satellite images. Satellite images are not photographs: they use computer-enhanced false colours which can be varied to emphasise a range of different features, such as rock types, vegetation or soil chemistry. Aerial photograph or a satellite image can be used to: 1. Topic 3.4 distinguish the overall distribution of rock types — i.e. distinguish between major regions of folded sedimentary rocks, igneous rocks and areas covered by recent sediments. Geological Mapping & Remote Image Interpretation Page 11 of 27 2. recognise major structures — i.e. folds, faults, batholiths, volcanoes, dykes, sand dune fields etc. 3. identify and describe topographic and cultural features. ________________________________________________ Above: Generalised geological map of Australia. Visit http://en.wikipedia.org /wiki/Image:Ausgeolbasic.jpg to view a colour version of this map. Topic 3.4 Geological Mapping & Remote Image Interpretation Page 12 of 27 Source: http://www.ga.gov.au/image_cache/GA7761.jpg Note similar maps for other resources e.g. tin, lead, zinc, copper etc. are also available at the Geoscience Australia website. Topic 3.4 Geological Mapping & Remote Image Interpretation Page 13 of 27 BARKER 1:250 000 geological map (Geological Survey of South Australia) (Note colour electronic versions of 1:250 000 geological maps are available for the whole of Australia at the Geoscience website) Topic 3.4 Geological Mapping & Remote Image Interpretation Page 14 of 27 ADELAIDE 1:250 000 geological map (Geological Survey of South Australia) Topic 3.4 Geological Mapping & Remote Image Interpretation Page 15 of 27 PARACHILNA 1:250 000 geological map (Geological Survey of South Australia) Topic 3.4 Geological Mapping & Remote Image Interpretation Page 16 of 27 COPLEY 1:250 000 geological map (Geological Survey of South Australia) Topic 3.4 Geological Mapping & Remote Image Interpretation Page 17 of 27 EXERCISES GEOLOGICAL MAPS 1. Explain the meaning of the term angle of dip as applied to sedimentary strata. 2. What is the direction of dip of sedimentary strata? 3. What is the strike of sedimentary strata? 4. The diagram below shows tilted sedimentary strata. Give the angle of dip, the direction of dip and the strike of these beds. 5. The adjacent diagram shows tilted sedimentary strata. Give the angle of dip, the direction of dip and the strike of these beds. Angle of dip Direction of dip Strike 6. The adjacent diagram shows a symbol which commonly used in geological maps a. What information does this symbol provide? b. Give the meanings of the parts of the symbol labelled A, B and C. is A. B. Topic 3.4 Geological Mapping & Remote Image Interpretation Page 18 of 27 C. 7. What do symbols D and E tell you about the dip of the strata? D. E. 8. How does a geological map tell you that strata are horizontal? 9. Describe the dip and strike of the sedimentary beds on the adjacent map. NE Beds Angle of Dip , Direction of Dip Strike SW Beds Angle of Dip , Direction of Dip Strike 10. Label the diagram below, which shows the different parts of a fold. 11. On a geological map, what do symbols F and G represent? F. G. Topic 3.4 Geological Mapping & Remote Image Interpretation Page 19 of 27 12. The diagrams below are geological maps showing examples of plunging folds. In each case, state the type of fold shown and give the direction and angle of plunge of the fold axis. Type of fold Type of fold Direction of plunge Direction of plunge Angle of plunge Angle of plunge 13. The diagram below shows a quarry face. a. b. On the diagram, label the strike and direction of dip of the stratum labelled A. The direction of dip is c. The strike is d. The estimated angel of dip is CROSS-SECTIONS & BLOCK DIAGRAMS 1. Name the structure shown in each of the following block diagrams. Topic 3.4 Geological Mapping & Remote Image Interpretation Page 20 of 27 2. The diagrams below are incomplete block diagrams of geological structures. Complete the blank face of each diagram and name the structure shown. Name of structure: Name of structure: Name of structure: Topic 3.4 Geological Mapping & Remote Image Interpretation Page 21 of 27 Name of structure: Name of structure: 3. The diagram below represents a cross section of an area in which there is a wide variety of rock types. Drill cores have been used to provide specimens of uranium-bearing minerals that are constituents of each of the following rocks: granite (1) andesite sill (2) dolerite dyke (3). In each case the percentage of the original uranium remaining in the rock, has been determined, and the results are shown in the first three columns of the table below. The half-life of the decay process is 713 my. Topic 3.4 Geological Mapping & Remote Image Interpretation Page 22 of 27 Location Rock type % uranium Age of (Ma) remaining 1. Granite 12.5 2. Andesite 25 3. Dolerite 50 rock a. Use the graph below to determine the ages of the three igneous rocks, and complete the fourth column of the table. b. What conclusion can be drawn about the age of the schist? c. Within what limits must the age of the conglomerate lie? Explain why this is so. d. During which geological period was the dyke intruded? Topic 3.4 Geological Mapping & Remote Image Interpretation Page 23 of 27 e. The layer (4) in the sand and gravel contains wood charcoal, stone implements and kangaroo bones. Analysis of the wood charcoal for radiocarbon shows that 12.5% of the original radioactive carbon 14 remains. The half-life of carbon 14 is 5730 years. Use the adjacent graph to determine the age of the charcoal. Age of charcoal f. 4. Describe the events recorded by the deposits associated with the formation of the charcoal. Use the table below to give the geological history of the area shown in the cross section. Rocks formed Events Youngest Oldest AERIAL PHOTOS & SATELLITE IMAGES Describe three differences between an aerial photograph and a satellite image. Topic 3.4 Geological Mapping & Remote Image Interpretation Page 24 of 27 Use the sheets of coloured aerial photographs and satellite images to answer the following questions. 1. The Snowy Mountains — satellite image. Satellite Image 1 is a perspective view, created from a Landsat satellite image, of the Snowy Mountains in New South Wales. The view shows the Snowy Mountains of Kosciusko National Park looking northeast along the Thredbo River Valley with the Great Dividing Range and Mt Kosciusko in the centre of the image. It was taken on 17 December 1994. The alpine areas appear pink and white, representing low alpine shrubs and rock. Some remaining snow banks appear light blue. a. Describe the overall topography of the area shown in the image. b. Name a geological feature that is probably responsible for the abrupt change in topography of the area to the right of the picture, and for the very straight course of the Thredbo River. c. Describe evidence in the image of human activity near location A. d. Lake Jindabyne, at location B, is a reservoir that was constructed as part of the Snowy Mountains Scheme. Suggest two reasons why it was constructed at that particular location. 2. San Andreas Fault, California — aerial photograph. The San Andreas Fault emerges from the Pacific Ocean and traverses hundreds of kilometres inland. It runs through California for about 970 km, from Imperial Valley to Point Arena. The fault marks the boundary between the North American and Pacific tectonic plates, which grind against one another. The resultant build-up and release of stress causes earthquakes. a. Topic 3.4 Compare the topography of the area immediately surrounding the fault with that further away from the fault. Geological Mapping & Remote Image Interpretation Page 25 of 27 b. Suggest a reason for the differences you have described. c. Suggest a reason for the difference between the topographies of the areas on the two sides of the fault. d. Describe any signs of human activity that are visible in the photograph. 3. The Riversleigh World Heritage Area — satellite image This image of the Riversleigh World Heritage Area in northern Queensland, (famous for its marsupial fossils) was captured on 4 March 1991 by the Landsat satellite. The image is based on computer-generated false colour. Thus, actively growing vegetation is coloured Red whilst bare soil, sand and rock are coloured Green. The softer bluish country to the southwest is probably the Mitchell Grasslands. The blue border defines the declared World Heritage Area. a. Estimate the area (in km2) of the World Heritage area. b. Describe the general direction of flow of the rivers in box X. c. Give a reason for your choice in part b. d. To what parts of the region is the actively growing vegetation limited? e. Hence what can you say about the climate of the region? f. Describe the topography and vegetation at locations P and Q on the image. P. Topic 3.4 Geological Mapping & Remote Image Interpretation Page 26 of 27 Q. 4. The Flinders Ranges — aerial photograph. The area shown on the photograph is Mainwater Pound, in the Gammon Ranges. It consists of eroded Proterozoic and Early Cambrian quartzites, siltstones and shales, from the sequence of the Adelaide Orogenic Belt (Adelaide Geosyncline). a. Compare the various types of topography in different parts of the region shown in the photograph. b. Identify the dominant geological structures present in the region. c. Why do some of the strata form such prominent ridges? Topic 3.4 Geological Mapping & Remote Image Interpretation Page 27 of 27
