Indirect Adjustment This simple example demonstrates how indirect
advertisement
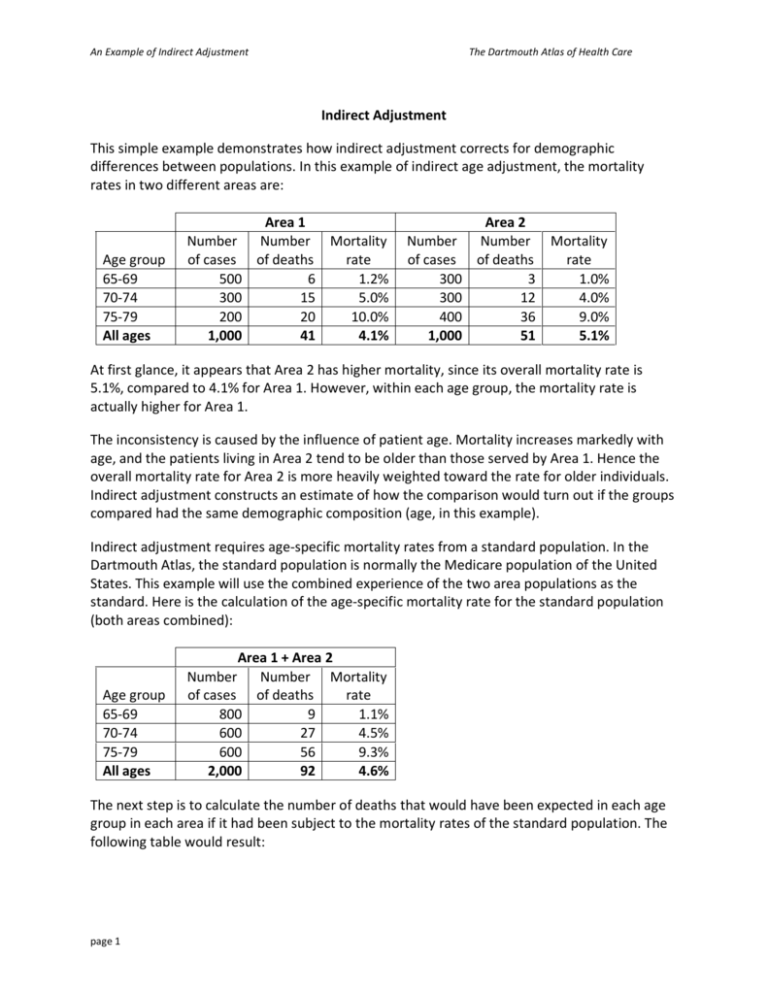
An Example of Indirect Adjustment The Dartmouth Atlas of Health Care Indirect Adjustment This simple example demonstrates how indirect adjustment corrects for demographic differences between populations. In this example of indirect age adjustment, the mortality rates in two different areas are: Area 1 Area 2 Number Number Mortality Number Number Mortality Age group of cases of deaths rate of cases of deaths rate 65‐69 500 6 1.2% 300 3 1.0% 70‐74 300 15 5.0% 300 12 4.0% 75‐79 200 20 10.0% 400 36 9.0% All ages 1,000 41 4.1% 1,000 51 5.1% At first glance, it appears that Area 2 has higher mortality, since its overall mortality rate is 5.1%, compared to 4.1% for Area 1. However, within each age group, the mortality rate is actually higher for Area 1. The inconsistency is caused by the influence of patient age. Mortality increases markedly with age, and the patients living in Area 2 tend to be older than those served by Area 1. Hence the overall mortality rate for Area 2 is more heavily weighted toward the rate for older individuals. Indirect adjustment constructs an estimate of how the comparison would turn out if the groups compared had the same demographic composition (age, in this example). Indirect adjustment requires age‐specific mortality rates from a standard population. In the Dartmouth Atlas, the standard population is normally the Medicare population of the United States. This example will use the combined experience of the two area populations as the standard. Here is the calculation of the age‐specific mortality rate for the standard population (both areas combined): Area 1 + Area 2 Number Number Mortality Age group of cases of deaths rate 65‐69 800 9 1.1% 70‐74 600 27 4.5% 75‐79 600 56 9.3% All ages 2,000 92 4.6% The next step is to calculate the number of deaths that would have been expected in each age group in each area if it had been subject to the mortality rates of the standard population. The following table would result: page 1 An Example of Indirect Adjustment Age group 65‐69 70‐74 75‐79 Mortality rate in standard population (1) 1.1% 4.5% 9.3% Number of patients Area 1 Area 2 (2) (3) 500 300 300 300 200 400 1,000 1,000 The Dartmouth Atlas of Health Care Expected number of deaths Area 1 Area 2 (1)x(2) (1)x(3) 5.63 3.38 13.50 13.50 18.67 37.33 37.79 54.21 Based on the age composition of each area’s residents, almost 38 deaths would be expected in Area 1, and more than 54 would be expected in Area 2. The actual observed numbers were 41 deaths in Area 1 and 51 deaths in Area 2. Using these figures, the standardized mortality ratio for each group can be calculated by dividing the observed number of deaths by the expected number of deaths in each group: Area 1: 41 ÷ 37.79 = 1.08 Area 2: 51 ÷ 54.21 = 0.94 Multiplying these standardized ratios by the overall combined mortality rate (4.6%) gives the adjusted rate for each area: Area 1: 1.08 x 4.6% = 5.0% Area 2: 0.94 x 4.6% = 4.3% This example shows how age adjustment corrects for the fact that the population in Area 2 is older, on average, than that of Area 1. Area 2’s unadjusted mortality rate is higher than Area 1’s – 5.1% versus 4.1% – but correcting for the differences in the age distributions (using the combined populations and experiences of the two areas as the standard) results in a higher age‐adjusted mortality rate for Area 1. This method is not limited to mortality rates. It can be used to standardize any event rate to a specific population’s average. Most Dartmouth Atlas rates are standardized to the U.S. average for the non‐HMO Medicare population in the following 20 age‐sex‐race strata: Black male, Non‐black male, Black female, Non‐black female, age 65‐69 age 65‐69 age 65‐69 age 65‐69 Black male, Non‐black male, Black female, Non‐black female, age 70‐74 age 70‐74 age 70‐74 age 70‐74 Black male, Non‐black male, Black female, Non‐black female, age 75‐79 age 75‐79 age 75‐79 age 75‐79 Black male, Non‐black male, Black female, Non‐black female, age 80‐84 age 80‐84 age 80‐84 age 80‐84 Black male, Non‐black male, Black female, Non‐black female, age 85‐99 age 85‐99 age 85‐99 age 85‐99 page 2


