(Microsoft PowerPoint - 3.26o \320\301\315\305\313\313\307\315
advertisement
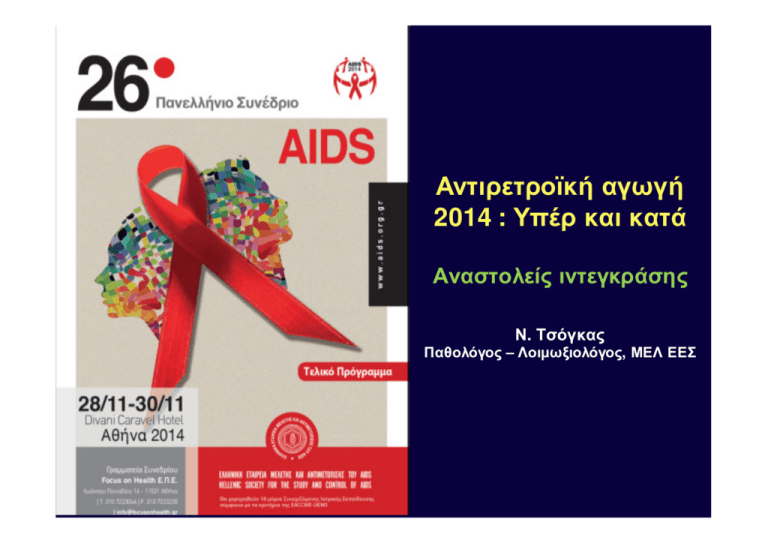
Αντιρετροϊκή αγωγή 2014 : Υπέρ και κατά Αναστολείς ιντεγκράσης Ν. Τσόγκας Παθολόγος – Λοιμωξιολόγος, ΜΕΛ ΕΕΣ HIV Viral Life Cycle Maturation Budding Uncoating Attachment fusion Integration Assembly Reverse transcription Transcription, translation HIV Viral Life Cycle Currently available integrase inhibitors Raltegravir (approved 10/07) Elvitegravir* (approved 8/12) Dolutegravir (approved 8/13) *Currently available only as part of a coformulated single-tablet regimen. Maturation Attachment fusion Budding Uncoating Integrase inhibitors Assembly Reverse transcription Transcription, translation Registrational Treatment-Naive Clinical Trials: Historical Data* HIV RNA <50 c/mL at Week 48 *This slide depicts data from multiple studies published from 2004-2014. Not all regimens have been compared head-to-head in a clinical trial GS-103 STRIBILD (n=353) SPRING-2 DTG (n=242) GS-102 STRIBILD (n=348) SINGLE DTG (n=414) GS-103 ATV + RTV (n=355) STaR RPV (n=394) SPRING-2 DTG (n=169) STARTMRK RAL (n=281) GS-102 ATRIPLA (n=352) ARTEMIS DRV + RTV (n=343) ECHO/THRIVE RPV (n=550) ECHO/THRIVE EFV (n=546) STaR EFV (n=392) STARTMRK EFV (n=282) GS 934 EFV (n=244) ARTEMIS LPV/r (n=346) CASTLE ATV + RTV (n=440) ABT 730 LPV/r qd (n=333) CASTLE LPV/r (n=443) ABT 730 LPV/r bid (n=331) GS-903 EFV (n=299) ASSERT EFV (n=193) HEAT LPV/r (n=343) HEAT LPV/r (n=345) ASSERT EFV (n=192) 0 90 89 88 88 87 86 86 86 84 84 83 82 82 82 80 78 78 77 76 76 76 NRTI Backbone TVD 3TC/ABC 71 68 67 59 10 20 30 40 50 60 70 80 Proportion with HIV-1 RNA <50 copies/mL at Week 48, % 90 100 RECOMMENDED INITIAL REGIMENS DHHS1 IAS-USA2 EACS3 (Dept. of Health and Human Services) 2013/2014 (International Antiviral Society USA Panel) (European AIDS Clinical Society) 2014 2014 NNRTI-based therapy EFV/TDF/FTC EFV +TDF/FTC or ABC/3TC* EFV + TDF/FTC or ABC/3TC** RPV/TDF/FTCa (only if HIV-1 RNA <100,000 c/mL) RPV/TDF/FTC if HIV-1 RNA <100,000 c/mL) RPV (only if HIV-1 RNA <100,000 c/mL) + TDF/FTC or ABC/3TC*** ATV/r + TDF/FTC ATV/r plus ABC/3TCa for patients who are HLA-B*5701 negative ATV/r + TDF/FTC or ABC/3TC* ATV/r + TDF/FTC or ABC/3TC** DRV/r + TDF/FTC DRV/r + TDF/FTC DRV/r + TDF/FTC or ABC/3TC** RAL + TDF/FTC RAL+ABC/3TC (alternative) EVG/c/TDF/FTC RAL +TDF/FTC RAL+ABC/3TC (alternative) RAL + TDF/FTC or ABC/3TC** EVG/c/TDF/FTC EVG/cobi/TDF/FTC DTG + ABC/3TC or TDF/FTC DTG + ABC/3TC or TDF/FTC Ritonavir-boosted PI-based therapy INI-based therapy *ABC/3TC only to be used in HLA-B*5701 negative patients with baseline plasma HIV-1 RNA <100,000 c/mL **ABC contra-indicated if HLA-B*5701 positive. Even if HLA-B*5701 negative, counselling on HSR risk still mandatory. ABC should be used with caution in patients with a high CVD risk and/or patients with a VL > than 100,000 c/mL. ***RPV: only if VL <100 000 c/mL; PPI contraindicated, H2 antagonists to be taken 12h before or 4h after RPV. 1. DHHS Guidelines for the Use of Antiretroviral Agents in HIV-1-Infected Adults and Adolescents, October 2013 2. Thompson MA, et al. JAMA 2014;312 (4):410–425 3. EACS Guidelines Version 7.02, June 2014 Σύνοψη κύριων χαρακτηριστικών των INSTIs RALTEGRAVIR EU status (Rx naïve) Approved ELVITEGRAVIR/c DOLUTEGRAVIR Approved Approved Dosing 400mg BD In single tablet OD with TDF/FTC/c 50mg OD, Single tab with ABV/3TC soon Food Regardless With food Regardless CYP3A, induces 2C9 /c inhibits 3A & 2D6, Pgp, BCRP, OAT1, MATE1 – (not same as Elvitegravir and ritonavir) UGT1A1 > CYP3A. Substrate of UGT1A3, UGT1A9, BCRP, and P-gp in vitro High via P-gp, CYP and MATE1 Moderate via CYP3A, P-gp, OCT2 Raised creatinine via MATE1 inhibition Raised creatinine via OCT2 inhibition Few Few Metabolism DDIs Renal effect Data on women, age >50yrs, low CD4/ & high VL 6 UGT1A Low Nil Some Package Insert: raltegravir, elvitegravir/cobi/, dolutegravir Δεδομένα μελετών από τη χρήση αναστολέων ιντεγκράσης σε πρωτοθεραπεύομενους (naive) ασθενείς Efficacy and Tolerability of Atazanavir, Raltegravir, or Darunavir with FTC/TDF: Landovitz RJ, Ribaudo HJ, Ofotokun I, Wang H, Baugh BP, Leavitt RY, Rooney JF, Seekins D, Currier JS, and Lennox JL for the A5257 Study Team Adapted from Landovitz RJ, et al. CROI 2014; oral presentation 85; Available from: http://www.natap.org/2014/CROI/croi_30.htm (accessed March 2014). Σχεδιασμός ACTG-5257 Ασθενείς με HIV λοίμωξη, ≥18 ετών, χωρίς προηγούμενη ART, VL ≥1000 αντίγραφα/mL σε κέντρα των ΗΠΑ (N=1809) Τυχαιοποίηση 1:1:1 σε ανοικτή θεραπεία Διαστρωμάτωση με βάση το αρχικό επίπεδο HIV-1 RNA (≥ έναντι < 100.000 αντίγραφα/mL), συμμετοχή στη μεταβολική υπομελέτη A5260s, καρδιαγγειακός κίνδυνος ATV 300 mg QD + RTV 100mg QD + FTC/TDF 200/300 mg QD RAL 400 mg BID + FTC/TDF 200/300 mg QD DRV 800 mg QD + RTV 100 mg QD + FTC/TDF 200/300 mg QD Ολοκλήρωση της μελέτης 96 εβδομάδες μετά την ένταξη του τελευταίου συμμετέχοντα Η παρακολούθηση συνεχίστηκε για 96 εβδομάδες μετά την τυχαιοποίηση του τελευταίου ασθενούς (εύρος 2-4 έτη) ACTG 5257 : Συνολικά αποτελέσματα στις 96 εβδ Virologic Failure Tolerability Failure Regimens equivalent in time to VF Significantly greater incidence of treatment failure with ATV/RTV vs RAL or DRV/RTV – ATV/RTV vs RAL 3.4% (-0.7 to 7.4) Favors RAL ATV/RTV vs RAL 13% (9.4-16.0) DRV/RTV vs RAL 5.6% (1.3 -9.9) DRV/RTV vs RAL 3.6% (1.4-5.8) 0 10 20 Considering both efficacy and tolerability, RAL superior to either boosted PI DRV/RTV superior to ATV/RTV Favors RAL ATVRTV vs RAL 15% (10-20) Favors RAL DRV/RTV vs RAL 7.5% (3.2-12.0) Favors DRV/RTV ATV/RTV vs DRV/RTV 7.5% (2.3-13.0) Favors DRV/RTV ATV/RTV vs DRV/RTV 9.2% (5.5-13.0) ATV/RTV vs DRV/RTV -2.2% (-6.7 to 2.3) -10 In part due to high proportion of pts with hyperbilirubinemia Composite Endpoint -10 0 10 20 -10 0 Difference in 96-Wk Cumulative Incidence (97.5% CI) Landovitz R, et al. CROI 2014. Abstract 85.. 10 20 STARTMRK: Raltegravir vs Efavirenz in TreatmentNaive Patients Randomized, double-blind (through 5 yrs), placebo-controlled, phase III trial Primary endpoint: HIV-1 RNA < 50 copies/mL at Wk 48 Stratified by HIV-1 RNA (> vs ≤ 50,000 copies/mL) and viral hepatitis status HIV-infected, treatment-naive patients with HIV-1 RNA > 5000 copies/mL and no resistance to EFV, TDF, or FTC (N = 563) Lennox J, et al. Lancet. 2009;374:796-806. Raltegravir 400 mg BID + TDF/FTC (n = 281) Efavirenz 600 mg QHS + TDF/FTC (n = 282) STARTMRK: RAL vs EFV in Treatment-Naive Patients: 5-Yr Final Report HIV-1 RNA < 50 c/mL (% ) RAL noninferior to EFV in HIV-1 RNA < 50 c/mL at Wk 48 (primary endpoint; ITT, NC = F analysis); superior from Wk 192 100 86 80 81 82 75 76 71 69 67 61 79 60 ∆: +9.5% (95% CI: 1.7% to 17.3%; noninferiority P < .001) 40 20 0 0 12 24 48 Pts at Risk, n RAL 281 276 279 280 EFV 282 282 282 281 72 96 120 Wks 144 168 192 216 240 281 282 281 282 277 281 280 281 281 282 281 282 277 282 279 279 Rockstroh J, et al. J Acquir Immune Defic Syndr. 2013;63:77-85. STARTMRK: RAL vs EFV in Treatment-Naive Patients: 5-Yr Final Report Efficacy as good as or better than EFV in all baseline subgroups tested CD4+ cell count at Wk 240: +374 (RAL) vs +312 (EFV) RAL associated with – Fewer CNS adverse events (39.1% vs 64.2%; P < .001) VF and Resistance at Wk 240 RAL (n = 281) EFV (n = 282) 55 (19.6) 59 (20.9) Resistance data available, n 23 20 INSTI or NNRTI mutations only, n 1 7 NRTI mutations only, n 3 2 NRTI + (RAL or EFV) resistance mutations, n 3 3 VF, n (%) – Fewer drug-related clinical adverse events (52.0% vs 80.1%; P < .001) – Fewer discontinuations due to adverse events (5% vs 9%) Rockstroh J, et al. J Acquir Immune Defic Syndr. 2013;63:77-85 plus Supplemental Digital Content. QDMRK: RAL QD Inferior to RAL BID at Wk 48 in Treatment-Naive Patients Randomized, noninferiority phase III trial of RAL 800 mg QD (n = 382) vs RAL 400 mg BID (n = 389), both with TDF/FTC[1] RAL QD inferior to RAL BID at Wk 48 in ITT (NC = F) analysis Lower RAL trough levels associated with higher risk of failure in QD arm but not in BID arm HIV-1 RNA < 50 c/mL (NC = F) 100 83 89 80 ∆: -5.7 (95% CI: -10.7 to -0.83; P for noninferiority = .044) 60 40 RAL 800 mg QD (n = 382) 20 RAL 400 mg BID (n = 389) 0 318/ 382 343/ 389 Wk 48 More resistance at failure in QD arm Parameter, n RAL QD (n = 382) RAL BID (n = 388) Pts with VF* and HIV-1 RNA > 400 c/mL 30 16 Resistance data available 27 11 FTC resistance only 11 2 Integrase inhibitor and FTC resistance 9 2 No evidence of resistance 7 7 *Failure included both failure to suppress and rebounders. Most patients with VF and RAL resistance had ≥ 2 mutations associated with resistance to RAL. PK studies of 2 new RAL formulations administered as 1200-mg once daily showed promise in healthy patients[2] 1. Eron J, et al. Lancet Infect Dis. 2011;11:907-915. 2. Krishna R, et al. EACS 2013, Abstract PE10/17. Elvitegravir/Cobicistat vs EFV or ATV/RTV + TDF/FTC in Treatment-Naive Pts Randomized, double-blind, active-controlled phase III studies Primary endpoint: HIV-1 RNA < 50 copies/mL at Wk 48 EVG/COBI/TDF/FTC QD (n = 348) Study 102[1] (N = 700) Treatment naive; HIV-1 RNA ≥ 5000 copies/mL; any CD4+ cell count; susceptible to TDF, FTC, and EFV, or ATV; eGFR ≥ 70 mL/min Study 103[2] (N = 708) EFV/FTC/TDF QD (n = 352) EVG/COBI/TDF/FTC QD (n = 353) ATV/RTV + TDF/FTC QD (n = 355) 1. Sax P, et al. Lancet. 2012;379:2439-2448. 2. DeJesus E, et al. Lancet. 2012;379:2429-2438. EVG/COBI/TDF/FTC Noninferior to EFV/TDF/FTC Through Wk 144 EVG/COBI/TDF/FTC (n = 348) Δ: 3.6% (-1.6 to 8.8) HIV-1 RNA < 50 copies/mL (%) 100 88 84 80 EFV/TDF/FTC (n = 352) Δ: 2.7% (-2.9 to 8.3) 84 82 – Results consistent across subgroups: BL HIV-1 RNA, CD4+ cell count, age, sex, race Δ: 4.9% (1.3 to 11.1) 80 75 – Treatment-related study d/c: 6% in EVG/COBI arm vs 7% in EFV arm at Wk 144 60 40 20 0 Wk 48 Wk 96 Wk 144 EVG/COBI arm noninferior to EFV arm at Wk 48 primary endpoint[1] and through Wk 144[2,3] VF: 7% in EVG/COBI arm and 10% in EFV arm at Wk 144 Similar CD4+ cell count increase at Wk 144: – +321 cells/mm3 (EVG/COBI) vs +300 cells/mm3 (EFV) 1. Sax PE, et al. Lancet. 2012;379:2439-2448. 2. Zolopa A, et al. J Acquir Immune Defic Syndr. 2013;63:96100. 3. Wohl D, et al. ICAAC 2013. Abstract H-672a. EVG/COBI/TDF/FTC Noninferior to ATV/RTV + TDF/FTC Through Wk 144 EVG/COBI/TDF/FTC (n = 353) Δ: 3.0% (-1.9 to 7.8) HIV-1 RNA < 50 copies/mL (%) 100 90 87 80 ATV/RTV + TDF/FTC (n = 355) Δ: 1.1% (-4.5 to 6.7) 83 82 – Results consistent across subgroups: BL HIV-1 RNA, CD4+ count, adherence, age, sex, race Δ: 3.1% (-3.2 to 9.4) 78 75 Treatment-related study d/c: 6% in EVG/COBI arm vs 9% in ATV/RTV arm at Wk 144 VF: 8% in EVG/COBI arm vs 7% in ATV/RTV arm at Wk 144 Similar CD4+ cell count increase at Wk 144: +280 cells/mm3 (EVG/COBI) vs +293 cells/mm3 (ATV/RTV) 60 40 20 0 Wk 48 Wk 96 Wk 144 EVG/COBI arm noninferior to ATV/RTV arm at Wk 48 primary endpoint[1] and through Wk 144[2,3] 1. De Jesus E, et al. Lancet. 2012;379:2429-2438. 2. Rockstroh J, et al. J Acquir Immune Defic Syndr. 2013;62:483-486. 3. Clumeck N, et al. EACS 2013. Abstract LBPS7/2. EVG/COBI/TDF/FTC Adverse Events Summary EVG/COBI vs EFV: fewer CNS, rash events; smaller increase in TC, HDL-C, and LDL-C (but similar increase in TC:HDL ratio), similar TG increase; more nausea[1] EVG/COBI vs ATV/RTV: less jaundice; similar increase in TC, HDL-C, and LDL-C; smaller TG increase[2] Small, rapid increase in serum creatinine related to inhibition of tubular secretion of creatinine by COBI – 0.14 ± 0.13 mg/dL at Wk 48; most change occurs by Wk 2[3] 4 pts (0.6% of total) developed tubulopathy, likely from TDF[3] 1. Sax P, et al. Lancet. 2012;379:2439-2448. 2. DeJesus E, et al. Lancet. 2012;379:2429-2438. 3. TDF/FTC/EVG/COBI [package insert]. EVG/COBI/TDF/FTC Resistance Summary EVG/COBI vs EFV through Wk 144[1-3] EVG/COBI (n = 348) EVG/COBI vs ATV/RTV through Wk 144[4-6] EFV (n = 352) EVG/COBI (n = 353) ATV/RTV (n = 355) Wk 48 96 144 48 96 144 Wk 48 96 144 48 96 144 Resistance at VF, n 8 +2 +0 8 +2 +4 Resistance at VF, n 5 +1 +2 0 +0 +2 INSTI RAMs, n 7 +2 +0 INSTI RAMS, n 4 0 +1 0 +0 +0 0 0 +2 NNRTI RAMs, n NRTI RAMs, n 8 8 +2 +0 2 +2 +1 +4 +1 PI RAMs, n NRTI RAMs, n 3 +1 +2 1. Sax PE, et al. Lancet. 2012;379:2439-2448. 2. Zolopa A, et al. J Acquir Immune Defic Syndr. 2013;63:96-100. 3. Wohl D, et al. ICAAC 2013. Abstract H-672a. 4. De Jesus E, et al. Lancet. 2012;379:2429-2438. 5. Rockstroh J, et al. J Acquir Immune Defic Syndr. 2013;62:483-486. 6. Clumeck N, et al. EACS 2013. Abstract LBPS7/2 Dolutegravir vs Currently “Preferred” Regimens in Treatment-Naive Pts Randomized, noninferiority phase III studies Primary endpoint: HIV-1 RNA < 50 copies/mL at Wk 48 SPRING-2[1] (active controlled) SINGLE[2] (placebo controlled) FLAMINGO[3] (open label) ART-naive pts VL ≥ 1000 c/mL (N = 822) ART-naive pts VL ≥ 1000 c/mL HLA-B*5701-neg CrCL > 50 mL/min (N = 833) ART-naive pts VL ≥ 1000 c/mL (N = 484) DTG 50 mg QD + 2 NRTIs* (n = 411) RAL 400 mg BID + 2 NRTIs* (n = 411) DTG 50 mg QD + ABC/3TC QD (n = 414) EFV/TDF/FTC QD (n = 419) DTG 50 mg QD + 2 NRTIs* (n = 242) DRV/RTV 800/100 mg QD + 2 NRTIs* (n = 242) *Investigator-selected NRTI backbone: either TDF/FTC or ABC/3TC. 1. Raffi F, et al. Lancet. 2013;381:735-743. 2. Walmsley S, et al. N Engl J Med. 2013;369:1807-1818. al. ICAAC 2013. Abstract H1464a. 3. Feinberg J, et SPRING-2: DTG vs RAL + 2 NRTIs in Naive Patients DTG 50 mg QD (n = 411) HIV-1 RNA < 50 copies/mL (% ) 100 Δ: 2.5% (-2.2% to 7.1%) 88 85 80 RAL 400 mg BID (n = 411) DTG noninferior to RAL at both Wk 48 primary endpoint[1] and Wk 96[2] Δ: 4.4% (-1.1% to 10.0%) Treatment-related study d/c: 2% in each arm at Wk 96 VF at Wk 96[2]: 5% (22/411) in DTG arm and 7% (29/411) in RAL arm Similar CD4+ cell count increase at Wk 96: 81 76 60 40 – +276 cells/mm3 (DTG) vs 20 0 361/ 411 351/ 411 Wk 48 333/ 411 314/ 411 +264 cells/mm3 (RAL) Wk 96 1. Raffi F, et al. Lancet. 2013;381:735-743. 2. Raffi F, et al. IAS 2013. Abstract TULBPE17. HIV-1 RNA < 50 c/mL at Wk 48 (% ) SINGLE: DTG + ABC/3TC vs EFV/TDF/FTC in Naive Patients at Wk 48 100 Δ +7.4% (95% CI +2.5% to +12.3%; P = .003) 88 Treatment-related study d/c: 2% in DTG arm vs 10% in EFV arm VF at Wk 48: 4% (18/414) in DTG arm and 4% (17/419) in EFV arm CD4+ cell count increase at Wk 48 greater with DTG: 81 80 60 40 20 0 364/ 414 340/ 419 DTG 50 mg + ABC/3TC QD EFV/TDF/ FTC QD Walmsley S, et al. N Engl J Med. 2013;369:1807-1818. DTG superior to EFV at Wk 48 primary efficacy endpoint – +267 cells/mm3 (DTG) vs +208 cells/mm3 (EFV) (P < .001) HIV-1 RNA < 50 c/mL at Wk 48 (% ) FLAMINGO: DTG vs DRV/RTV + 2 NRTIs in Naive Patients at Wk 48 Δ +7.1% (95% CI: +0.9% to +13.2%; P = .025) 100 90 83 80 60 – Treatment-related study d/c: 2% in DTG arm vs 4% in DRV/RTV arm VF at Wk 48: < 1% (n = 2) in each arm 40 Similar CD4+ cell count increase at Wk 48: 20 0 DTG superior to DRV/RTV at Wk 48 primary efficacy endpoint 217/ 242 200/ 242 DTG 50 mg QD + NRTIs DRV/RTV 800/100 mg QD + NRTIs Feinberg J, et al. ICAAC 2013. Abstract H1464a. – +210 cells/mm³ in each arm Virologic Suppression at Wk 48 by Baseline HIV-1 RNA STARTMRK[1] SPRING-2[4] Difference, % (RAL-EFV) and 95% CI Difference, % (DTG-RAL) and 95% CI In favor of EFV ≤ 100,000 c/mL > 100,000 c/mL -20 -10 In favor of RAL ≤ 100,000 c/mL > 100,000 c/mL In favor of RAL 0 10 20 30 -20 -10 Difference, % (EVG/COBI-EFV) and 95% CI -15 -10 -5 In favor of EVG/COBI 0 5 10 15 In favor of EVG/COBI 0 5 20 30 In favor of DTG In favor of EFV ≤ 100,000 c/mL > 100,000 c/mL -20 -10 0 10 20 30 FLAMINGO[5] Difference, % (EVG/COBI-ATV/RTV) and 95% CI -15 -10 -5 10 Difference, % (DTG-EFV) and 95% CI Study 103[3] In favor of ATV/RTV ≤ 100,000 c/mL > 100,000 c/mL 0 SINGLE[4] Study 102[2] In favor of EFV ≤ 100,000 c/mL > 100,000 c/mL In favor of DTG 10 15 Difference , % (DTG-DRV/RTV) and 95% CI In favor of DRV/RTV ≤ 100,000 c/mL > 100,000 c/mL -20 -10 In favor of DTG 0 10 20 30 1. Lennox J, et al. Lancet. 2009;374:796-806. 2. Sax PE, et al. Lancet. 2012;379:2439-2448. 3. DeJesus E, et al. Lancet. 2012;379:24292438. 4. Brinson C, et al. CROI 2013. Abstract 554. 5. Feinberg J, et al. ICAAC 2013. Abstract H1464a. 40 Similar Efficacy of INSTIs (RAL or DTG) + ABC/3TC or TDF/FTC, Even for High BL VL HIV-1 RNA < 50 c/mL at Wk 48 by FDA Snapshot Analysis (%) In SPRING-2, similar efficacy with ABC/3TC or TDF/FTC + RAL or DTG, including with high BL HIV-1 RNA* ABC/3TC 100 88 91 TDF/FTC 81 86 82 76 72 64 80 60 40 20 n/ N= 0 225/ 257 306/ 335 < 100k 36/ 42 72/ 88 100K - < 250K 13/ 16 29/ 38 250K - 500K Baseline HIV-1 RNA (c/mL) *Pooled data from both INSTIs. Eron J, et al. Glasgow 2012. Abstract P204. 13/ 18 18/ 28 > 500K Dolutegravir: Adverse Events Summary DTG vs RAL[1,2] – Adverse events similar between arms DTG vs EFV[3] – CNS events and rash more common with EFV; insomnia more frequent with DTG DTG vs DRV/RTV[4] – More diarrhea with DRV/RTV; more headache with DTG DTG associated with small, rapid increase in serum creatinine in first 4 wks of tx that remained stable through Wk 48 (mean change from baseline: +0.11 mg/dL; range: -0.60 to 0.62 mg/dL)[5] – Rise in creatinine related to inhibition of tubular secretion of creatinine by DTG – No drug-related discontinuations due to renal adverse events 1. Raffi F, et al. Lancet. 2013;381:735-743. 2. Raffi F, et al. IAS 2013. Abstract TULBPE17. 3. Walmsley S, et al. N Engl J Med. 2013;369:1807-1818. 4. Feinberg J, et al. ICAAC 2013. Abstract H1464a. 5. Dolutegravir [package insert]. Resistance Summary DTG vs RAL[1,2] – 0 pts with resistance in DTG arm – 1 pt with INSTI-R and 4 pts with NRTI-R with RAL at Wk 48; no additional resistance by Wk 96 DTG vs EFV[3] – 0 pts with resistance in DTG arm – 1 pt with NRTI and 4 with NNRTI resistance in EFV arm DTG vs DRV/RTV[4] – No pts with resistance in either arm 1. Raffi F, et al. Lancet. 2013;381:735-743. 2. Raffi F, et al. IAS 2013. Abstract TULBPE17. 3. Walmsley S, et al. N Engl J Med. 2013;369:1807-1818. 4. Feinberg J, et al. ICAAC 2013. Abstract H1464a. Aλληλεπιδράσεις INSTIs με άλλα αντιρετροϊκά Raltegravir Elvitegravir (with TDF/FTC/c) Dolutegravir Etravirine Should not be used without coadministration of atazanavir/r, darunavir/r or lopinavir/r Efavirenz Dose adjustment to 50mg BID Nevirapine No dose adjustment As a complete regimen, should not be administered with other ARV Fosamprenavir/r ; Should be avoided Dose adjustment to 50mg BID Tipranavir/r Other ARV 29 Package Insert: raltegravir, elvitegravir/cobi/, dolutegravir Limited data Drug–Drug Interactions With Integrase Inhibitors and Key Drugs RAL[1,2] Rifampin Aluminum- or magnesiumcontaining antacids EVG/COBI[1] Antacids Benzodiazepines Beta blockers Calcium channel blockers Erectile dysfunction drugs Inhaled/injectable corticosteroids MVC OCPs (norgestimate) Rifampin Statins DTG[3] EFV ETR FPV/RTV Medications containing polyvalent cations (Ca++, Mg++), including laxatives, antacids Metformin Rifampin TPV/RTV 1. DHHS Adult Guidelines. February 2013. 2. Raltegravir [package insert]. 3. Dolutegravir [package insert]. Δεδομένα από μελέτες τροποποίησης (Switch Studies) αντιρετροϊκών σχημάτων με τη χρήση αναστολέων ιντεγκράσης Switching Virologically Suppressed Patients to RAL SWITCHMRK-1 and -2[1] – Switching to RAL inferior to remaining on LPV/RTV-based regimen in pts with HIV-1 RNA < 50 c/mL for > 3 mos, particularly among those with previous VF – TC, non–HDL-C, and TG improved in switch pts SPIRAL[2] – Switching from any boosted PI to RAL noninferior to remaining on boosted PIbased regimens through Wk 48 in pts with HIV-1 RNA < 50 c/mL for ≥ 6 mos Switching to RAL significantly improved lipids and TC:HDL-C ratio EASIER/ANRS 138[3] – Switch from ENF to RAL regimens maintained virologic suppression through Wk 48 in patients with multidrug resistance and HIV-1 RNA < 400 c/mL for ≥ 3 mos 1. Eron J, et al. Lancet. 2010;375:396-407. 2. Martinez E, et al. AIDS. 2010;24:1697-1707. 3. Gallien S, et al. J Antimicrob Chemother. 2011;66:2099-2106. Study 123: Switch From RAL + TDF/FTC to EVG/COBI/TDF/FTC Open-label, multicenter, 48-wk pilot study of switch from RAL + TDF/FTC to EVG/COBI/TDF/FTC in pts with HIV-1 RNA < 50 c/mL for 6 mos (N = 48) Primary endpoint: HIV-1 RNA < 50 c/mL at Wk 12 postswitch Secondary endpoints: Safety and tolerability by Wk 24 and Wk 48 HIV-1 RNA < 50 c/mL at Wk 24 and Wk 48 postswitch All subjects maintained virologic suppression at Wks 12 and 24 – 38/38 subjects who reached Wk 48 at time of report also suppressed TC and LDL-C improved; no renal AEs Crofoot G, et al. IAS 2013. Abstract TUPE283. HIV-1 RNA < 50 c/mL (%) 100 80 60 40 20 0 48/48 48/48 38/38* Wk 12 Wk 24 Wk 48 Study 0115 (STRATEGY PI) Study Design Multicenter, randomized, open-label, 96-week study n =293 STRATEGY-PI PI + RTV + TVD • • • • • STB 2:1 HIV-1 RNA <50 c/mL for ≥6 months ≤ 2 prior ARV regimens No resistance to FTC or TDF No history of virologic failure eGFRCG ≥70 mL/min n =140 PI + RTV + TVD Week 48 Week 96 Primary endpoint: HIV-1 RNA <50 c/mL at Week 48 by Snapshot (noninferiority margin of 12%). If noninferiority is established, then superiority will be tested. Secondary endpoint: Safety and tolerability at Week 48 & 96 Other endpoints: Patient-reported outcomes* *HIV-specific, health-related quality of life questionnaires: HIV Symptom Index, HIV Treatment Satisfaction Arribas J, et al. CROI 2014. Boston, MA #551LB Arribas J, et al. Lancet Inf ect Dis. 2014;14:581-589 Study 0115 (STRATEGY PI) Enrollment and Antiretroviral History Reasons for enrollment and ART history At screening (n =433), % Reasons subject choose to enroll in study* Desire to simplify current regimen 86 Concerned about long-term side effects of current regimen 12 Have trouble taking current regimen on a regular basis 3 Have trouble tolerating current regimen well due to side effects 3 Protease inhibitor use Atazanavir 40 Darunavir 40 Lopinavir 17 Fosamprenavir 3 Saquinavir Prior regimen(s) On 1st antiretroviral regimen On 2nd antiretroviral regimen <1 On > 2 prior regimens 2 *Subject can prov ide more than one reasons f or enrollment in study Arribas J, et al. CROI 2014. Boston, MA #551LB Arribas J, et al. Lancet Inf ect Dis. 2014;14:581-589 79 19 100 90 94% E/C/F/TDF STB (n=290) (n=290) PI + RTV + FTC/TDF (n=139) 87% 95% CI for Difference 80 Favors Favors PI + RTV + TVD STB Subjects, % 70 60 50 6.7 40 30 0.4 20 10 6% <1% 1% 0 Virologic Success W48 Virologic Failure W48 12% -12% No Virologic Data W48 0 ΔWeek 48 (mean) P-value (Δ W48 - BL) STB 603 +40 <0.001 PI + RTV + TVD 625 +32 =0.025 Arribas J, et al. CROI 2014. Boston, MA #551LB Arribas J, et al. Lancet Inf ect Dis. 2014;14:581-589 12% Prespecified sequential testing Statistical superiority (P = 0.025) Baseline (mean) CD4 Cell Count (cells/mm3) 13.7 Study 0115 (STRATEGY PI) – Week 48 Virologic Success and Difference By Subgroups STB E/C/F/TDF Favors PI + RTV + TVD PI + RTV + FTC/TDF Favors STB Overall Age <40 years Age ≥40 years Male Female White Non-White Atazanavir Darunavir Lopinavir One regimen Two regimens 0 20 40 60 80 100 -50 -40 -30 -20 -10 0 10 20 30 40 50 Virologic success (%) Difference (%) Arribas J, et al. CROI 2014. Boston, MA #551LB Arribas J, et al. Lancet Inf ect Dis. 2014;14:581-589 Study 0115 (STRATEGY PI) – Week 48 Adverse Events (≥5%) in Either Treatment Arm STB (n =293) PI + RTV + TVD (n =140) Nasopharyngitis 12 10 Upper respiratory infection 8 4 Diarrhea 7 8 Nausea 7 3 Headache 6 6 Back pain 5 1 Anxiety 6 4 Cough 5 3 Depression 4 6 Insomnia 3 5 Adverse events*, % *Treatment-emergent adv erse events occurring in ≥5% of subjects in either treatment arm Adverse events consistent with known safety profile of STB Arribas J, et al. CROI 2014. Boston, MA #551LB Arribas J, et al. Lancet Inf ect Dis. 2014;14:581-589 Study 0115 (STRATEGY PI) – Week 48 Change From Baseline in Fasting Lipids by Subgroup ATV + RTV Subgroup Median change from baseline at Week 48, Q1, Q3 (mg/dL) STB Atazanavir TC LDL TG P=0.11 P=0.20 P=0.01 -5 -15 HDL TC LDL P=0.12 P=0.43 P=0.56 4 3 -3 0 -2 -2 -12 -25 STB Lopinavir TG HDL TC LDL TG HDL P=0.32 P=0.03 P=0.002 P=0.16 P=0.003 P=0.016 15 5 LPV/r Subgroup Darunavir STB 15 15 5 DRV + RTV Subgroup 15 0 0 3 0 0 -5 0 -1 -5 -2 -5 -15 -25 -11 -9 -15 -13 -25 -25 -35 -35 -35 -45 -45 -45 -46 -55 -55 -55 Changes from baseline in total cholesterol/HDL ratios were not statistically significant. HDL, high density lipoprotein cholesterol; LDL, low density lipoprotein cholesterol; TC, total cholesterol; TG, triglycerides Arribas J, et al. CROI 2014. Boston, MA #551LB Arribas J, et al. Lancet Inf ect Dis. 2014;14:581-589 5 2 5 Study 0121 (STRATEGY NNRTI) Study Design Multicenter, randomized, open-label, 96-week study n =291 STRATEGY-NNRTI NNRTI + TVD • • • • • STB 2:1 HIV-1 RNA <50 c/mL for ≥6 months ≤ 2 prior ARV regimens No resistance to FTC or TDF No history of virologic failure eGFRCG ≥70 mL/min n =143 NNRTI + TVD Week 48 Week 96 Primary endpoint: HIV-1 RNA <50 c/mL at Week 48 by Snapshot (noninferiority margin of 12%). If noninferiority established, test for superiority Secondary endpoint: Safety and tolerability at Weeks 48 & 96 Other endpoints: Patient-reported outcomes* *Expanded HIV Sy mptom Index and HIV Treatment Satisfaction questionnaires Pozniak A, et al. CROI 2014. Boston, MA. #553LB Pozniak A, et al. Lancet Inf ect Dis. 2014;14:590-599 Study 0121 (STRATEGY NNRTI) Reasons for Enrollment and ART History Reasons for enrollment and ART history Reasons subject choose to enroll in study* Desire to simplify current regimen† Concerned about long-term side effects of current regimen Have trouble tolerating current regimen well due to side effects Have trouble taking current regimen on a regular basis NNRTI use‡ Efavirenz§ Nevirapine Rilpivirineδ On 1st antiretroviral regimen On 2nd antiretroviral regimen On > 2nd antiretroviral regimen *Subjects can prov ide more than one reasons for enrollment in study. † “Simplif y” was def ined by the subject and may have other meanings beside number of pills and/or dosing frequency. ‡ <1% of subjects were on etrav irine at screening. 74% of subjects were on Atripla δ4% of subjects were on Complera § Pozniak A, et al. CROI 2014. Boston, MA. #553LB Pozniak A, et al. Lancet Inf ect Dis. 2014;14:590-599 At screening (n=434), % 48 20 14 5 78 17 4 91 9 <1 Study 0121 (STRATEGY NNRTI) – Week 48 Primary Endpoint: HIV-1 RNA < 50 c/mL: Week 48 100 90 93% E/C/F/TDF (n=290) STB (n=290) NNRTI + FTC/TDF (n=143) 88% Subjects, % 80 95% CI for Difference 70 Favors Favors NNRTI + TVD STB 60 50 40 30 20 10 1% <1% 0 Virologic Success W48 Virologic Failure W48 6% -0.5 11% No Virologic Data W48 -12% 0 Baseline (mean) ΔWeek 48 (mean) P value (Δ W48 - BL) STB 586 +56 <0.001 NNRTI + TVD 593 +58 <0.001 CD4 Cell Count (cells/mm3) Pozniak A, et al. CROI 2014. Boston, MA. #553LB Pozniak A, et al. Lancet Inf ect Dis. 2014;14:590-599 5.3 12.0 12% Study 0121 (STRATEGY NNRTI) – Week 48 Virologic Success and Difference By Subgroups STB E/C/F/TDF Favors NNRTI + TVD Favors STB NNRTI + FTC/TDF Overall Age <40 years Age ≥40 years Male Female White Non-White Efavirenz Non-Efavirenz One regimen Two regimens 0 20 40 60 80 100 -50 -40 -30 -20 -10 0 10 20 30 40 50 Virologic success (%) Difference (%) Pozniak A, et al. CROI 2014. Boston, MA. #553LB Pozniak A, et al. Lancet Inf ect Dis. 2014;14:590-599 Study 0121 (STRATEGY NNRTI) – Week 48 Adverse Events (≥5%) in Either Treatment Arm STB (n =291) NNRTI + TVD (n =143) Upper respiratory infection 10 7 Headache* 10 3 Nasopharyngitis 9 10 Diarrhea 8 7 Nausea* 8 3 Cough 7 2 Insomnia 6 5 Fatigue 5 1 Arthralgia 5 3 Adverse events,% Treatment-emergent adv erse events occurring in ≥5% of subjects in either treatment arm * Percentage dif f erence of ≥5% between groups. Statistical significance have not been examined. Adverse events consistent with known safety profile of STB Pozniak A, et al. CROI 2014. Boston, MA. #553LB Pozniak A, et al. Lancet Inf ect Dis. 2014;14:590-599 Study 0121 (STRATEGY NNRTI) – Week 48 Change From Baseline in Fasting Lipids in Overall and EFV Subgroup Efavirenz Subgroup Overall Total-c Median changes from baseline (mg/dL) 10 P =0.071 LDL-c P =0.082 TG P =0.57 HDL-c 10 P =0.001 Total-c P =0.010 LDL-c P =0.001 2 P =0.008 3 1 1 1 1 0 0 P =0.48 HDL-c 5 5 5 TG 0 0 -1 -2 -5 -5 -3 -10 -3 -4 STB (n =271) NNRTI + TVD (n =127) -10 -5 -8 STB (n =214) ATR (n =92) P values for all comparisons between treatment groups using ANOVA were not significant except for TG (p <0.001) Median BL Values (mg/dL) 189 186 119 115 112 101 53 51 Small decrease from baseline at Week 48 in HDL-c after switching to STB 189 186 120 115 114 107 Small decreases from baseline in total, LDL, and HDL cholesterols at Week 48 in EFV switches Changes from baseline in total cholesterol/HDL ratios were not statistically significant. Pozniak A, et al. CROI 2014. Boston, MA. #553LB Pozniak A, et al. Lancet Inf ect Dis. 2014;14:590-599 52 51 Δεδομένα μελετών από τη χρήση αναστολέων ιντεγκράσης σε προθεραπευμένους (treatment-experienced) ασθενείς TRIO Study (ANRS 139): RAL + ETR + DRV/RTV in Treatment-Experienced Pts Multicenter phase II study of DRV/RTV + ETR + RAL (N = 103); addition of NRTIs, ENF at discretion of physician – Inclusion criteria: susceptibility to DRV and ETR based on ≤ 3 DRV and ≤ 3 ETR RAMs, respectively – 59% of pts had < 1 active agent in OBR, as assessed by GSS 86% of pts reached HIV-1 RNA < 50 c/mL at Wk 48 (95% CI: 79% to 93%)[1] Of 100 pts entering extension trial through Wk 96, 88% achieved HIV-1 RNA < 50 c/mL (95% CI: 82% to 94%)[2] Median CD4+ cell count change: +150 cells/mm3 4 tx-related grade 3/4 AEs reported before Wk 48: recurrent epidermal necrolysis (n = 1) (study d/c); nephrolithiasis (n = 1); lipodystrophia (n = 1); muscle spasm (n = 1) No further events between Wks 48 and 96 1. Yazdanpanah Y, et al Clin Infect Dis. 2009;49:1441-1449. 2. Fagard C, et al. Acquir Immune Defic Syndr. 2012;59:489-493. Study 145: Elvitegravir vs Raltegravir in TreatmentExperienced Patients Randomized, placebo-controlled phase III study Wk 48 HIV-infected pts, HIV-1 RNA ≥ 1000 copies/mL, resistance or 6 mos of exposure to ≥ 2 antiretroviral classes (N = 702) Elvitegravir 150 mg (or 85 mg) QD* + Boosted PI‡ + Third Agent§ (n = 351) Raltegravir 400 mg BID + Boosted PI‡ + Third Agent§ (n = 351) *EVG currently unavailable as single agent. †EVG dose reduced to 85 mg QD for pts receiving ATV/RTV or LPV/RTV as part of background regimen. ‡Background regimen to include fully active RTV-boosted PI, selected using resistance testing. §Selected from ENF, ETR, MVC, or NRTI. Option of also adding FTC or 3TC for pts with M184V/I. Molina J, et al. Lancet Infect Dis. 2012;12:27-35. Wk 96 Study 145: EVG Noninferior to RAL at Wks 48 and 96 Subjects (% ) 100 EVG (n = 351) RAL (n = 351) 80 60 40 20 0 Similar incidence of resistance at VF with EVG vs RAL – Integrase resistance: 6.6% vs 7.4% 59 58 48 45 29 26 26 26 22 23 19 19 – OBR resistance: 7.4% vs 7.1% Both regimens well tolerated Wk 48 Wk 96 Wk 48 Wk 96 Wk 48 Wk 96 Virologic Virologic Response Failure* Other – Higher rates of diarrhea with EVG at Wks 48 and 96 – Discontinuations: 3% vs 4% *VF includes never suppressed, rebound, switch of BR, and d/c due to lack of efficacy. Others include death, discontinuation due to AE, investigator’s discretion, lost to follow-up, pregnancy, protocol violation, subject noncompliance, withdrawal of consent. Elion R, et al. J Acquir Immune Defic Syndr. 2013;63:494-497. SAILING: Dolutegravir vs Raltegravir in ART-Exp’d, Integrase Inhibitor–Naive Pts Randomized, double-blind, noninferiority, phase III study Stratified by number of fully active background agents, use of DRV, screening HIV-1 RNA (≤ vs > 50,000 copies/mL) Treatment-experienced, integrase inhibitor–naive patients with HIV-1 RNA > 400 copies/mL and ≥ 2 class resistance (N = 715) Dolutegravir 50 mg QD + Raltegravir placebo + OBR* (n = 354) Raltegravir 400 mg BID + Dolutegravir placebo + OBR* (n = 361) *OBR comprising at least 1 and no more than 2 active agents. Cahn P, et al. Lancet. 2013;382:700-708. Wk 48 SAILING: Superior Rate of Virologic Suppression With DTG vs RAL at Wk 48 Lower incidence of resistance at VF with DTG vs RAL 100 Subjects (% ) 80 Δ: 7.4% (95% CI: 0.7-14.2; P = .03) DTG + OBR (n = 354) RAL + OBR (n = 361) 71 64 60 28 20 – Grades 2-4: 8% vs 9% 9 9 0 – OBR resistance: 1% (4/354) vs 3% (12/361) Both regimens well tolerated with similar AE profiles 40 20 – Integrase resistance: 1% (4/354) vs 5% (17/361); P = .003 Virologic Virologic No Wk Success Nonresponse 48 Data Cahn P, et al. Lancet. 2013;382:700-708. – Discontinuations: 3% vs 4% No difference in outcome between study arms when combined with fully active DRV/RTV VIKING-3: Dolutegravir After Failure of Integrase Inhibitor– Based Regimen Phase III single-arm trial Pts with HIV-1 RNA ≥ 500 c/mL, RAL and/or EVG resistance, and resistance to ≥ 2 other antiretroviral classes* (N = 183) Day 8 Wk 24 Wk 48 Dolutegravir 50 mg BID + Continue Failing Regimen Dolutegravir 50 mg BID + Optimized Background Regimen With Overall Susceptibility Score ≥ 1 (ie, ≥ 1 active drug) Functional Monotherapy Optimized Therapy Mean HIV-1 RNA change from baseline to Day 8 – Overall: -1.4 log10 copies/mL (P < .001) – No primary integrase resistance mutations at BL: -1.6 log10 copies/mL – Q148 + ≤ 1 secondary integrase resistance mutation: -1.1 log10 copies/mL – Q148 + ≥ 2 secondary integrase resistance mutations: -1.0 log10 copies/mL *Detected at screening or based on historical evidence. Nichols G, et al. Glasgow 2012. Abstract O232. VIKING-3: Efficacy of DTG in INSTI-Experienced Pts at Wk 48 24-wk data on full cohort (N = 183) and 48-wk data on first 114 pts Outcome, n (% ) HIV-1 RNA < 50 c/mL at Wk 24 (snapshot, ITT-E) Response rates affected by baseline INSTI resistance but not overall susceptibility score of background regimen HIV-1 RNA < 50 c/mL at Wk 24 by INSTI Mutation(s), n/N (% ) Wk 24 Wk 48 (n = 183) (n = 114) 126 (69) 64 (56) Virologic nonresponse 50 (27) 44 (39) d/c due to AE or death 5 (3) 5 (4) Overall Susceptibility Score 0 1 ≥2 Total No Q148 4/4 (100) 35/40 (83) 57/70 (76) 96/114 (79) Q148 + 1 2/2 (100) 8/12 (67) 10/17 (59) 20/31 (65) Q148 + ≥ 2 1/2 (50) 2/11 (18) 1/3 (33) 4/16 (25) Nichols G, et al. IAS 2013. Abstract TULBPE19. Raltegravir Summary: Advantages and Disadvantages Advantages Disadvantages INSTI with longest track record of safety and efficacy—approved in 2007 Noninferior to EFV in initial therapy at Wk 48 (superior from Wk 192 through Yr 5 final analysis) Fewer CNS adverse effects, less rash, and better lipids than EFV Few drug–drug interactions No food effect Conflicting data on efficacy in switch strategies Integral part of many regimens in treatment-experienced pts Twice-daily dosing No FDC available or planned Rare CNS, cutaneous, and musclerelated adverse effects Inferior to DTG in treatmentexperienced patients Risk of resistance at VF, especially in treatment-experienced pts When VF failure occurs with resistance, 2-class resistance is common Elvitegravir Summary: Advantages and Disadvantages Advantages Disadvantages Only INSTI currently available as a 1-pill once-daily regimen Noninferior to EFV and ATV/RTV in initial therapy Maintains antiviral activity as well as comparators across HIV-1 RNA and CD4+ cell count strata Fewer CNS adverse effects, less rash, and better lipids than EFV Less jaundice than ATV/RTV Appears to be effective switch regimen for patients on first-line RAL Noninferior to RAL in treatmentexperienced patients Not recommended for patients with eGFR < 70 mL/min Must be taken with food Cobicistat inhibits tubular secretion of creatinine, increasing Cr levels More nausea than EFV Risk of resistance at VF, especially in treatment-experienced patients When VF occurs with resistance, 2-class resistance is common Many COBI-related drug–drug interactions Currently only available in FDC, limiting regimen flexibility Dolutegravir Summary: Advantages and Disadvantages Advantages Disadvantages Once-daily administration Small mg dose and tablet size Noninferior to RAL and superior to EFV and DRV/RTV Maintains comparable or better virologic activity to EFV, RAL, DRV/RTV across low and high HIV1 RNA Fewer CNS and rash events vs EFV When VF occurs, no integrase resistance mutations as yet detected in treatment-naive patients Few drug–drug interactions Can be taken with or without food Not yet available as part of FDC Inhibits tubular secretion of creatinine, increasing Cr levels Relatively little clinical experience compared with RAL (especially) and EVG Συμπεράσματα Ενώ υπάρχουν αρκετές επιλογές στην έναρξη θεραπείας, η ανάλυση των δεδομένων ευνοεί τη χρήση των αναστολέων ιντεγκράσης για τους περισσότερους πρωτοθεραπεύομενους ασθενείς λόγω: – Υψηλής δραστικότητας, καλής ανοχής, απουσίας σημαντικών διαταραχών των λιπιδίων – Χαμηλής μεταδιδόμενης αντοχής – Λίγων αλληλεπιδράσεων με φάρμακα (RAL, DTG) – Χαμηλής αντοχής, ειδικά με DTG – Απλού δοσολογικού σχήματος (DTG, EVG) Study 0121 and 0115 (STRATEGY PI and NNRTI) – Week 48 Συμπεράσματα Η τροποποίηση σε STB από PI+RTV+TVD ή NNRTI+TVD μετά από 48 εβδομάδες: STB μη-κατώτερο στη διατήρηση της ιολογικής καταστολής – 94% STB (στατιστικά ανώτερο) vs. 87% PI+RTV+TVD – 93% STB vs. 88% NNRTI+TVD Δεν παρατηρήθηκε αντοχή μετά την τροποποίηση σε STB STB καλά ανεκτό, με τις αναμενόμενες ανεπιθύμητες ενέργειες (ΑΕ) – Διακοπές αγωγής λόγω ΑΕ, σπάνιες – Ιδια ποσοστά ΑΕ μεταξύ STB και PI+RTV+TVD, ενώ αναφέρθηκαν υψηλότερα ποσοστά κεφαλαλγίας και ναυτίας στην ομάδα του STB σε σύγκριση με την ομάδα των NNRTI+TVD – Ποσοστό διάρροιας και μετεωρισμού χαμηλότερο στην ομάδα του STB μετά την τροποποίηση από PI+RTV+TVD, ενώ χαμηλότερο ποσοστό νευροψυχιατρικών συμπτωμάτων στην ομάδα του STB σε σύγκριση με την ομάδα του EFV – Μικρές μη-επιδεινούμενες αλλαγές σε SCr και eGFR, λόγω της γνωστής αναστολής των MATE-1 μεταβιβαστών από το cobicistat Mills A, et al. IAC 2014. Melbourne, Australia. #WEPE092 Συμπεράσματα INSTI κατάλληλοι για αρκετούς προθεραπευμένους ασθενείς – Για ΙNSTI-naive ασθενείς, όλοι οι INSTI είναι κατάλληλοι – DTG ανώτερο από το RAL, EVG μη κατώτερο από το RAL – Για INSTI προθεραπευμένους ασθενείς, DTG ανώτερο του RAL – Διασταυρούμενη αντοχή ανάμεσα σε EVG και RAL Δυσκολία στη χρήση EVG λόγω της ύπαρξης μόνο ως FDC, έλλειψη δεδομένων για συγχορήγηση με άλλα ARV Μεγαλύτερη κλινική εμπειρία και περισσότερα δεδομένα έχει το RAL ως μέρος του νέου αντιρετροϊκού σχήματος για ασθενείς που έχουν λάβει σχήματα με NRTI, NNRTI, PI DTG πιθανά αποτελεί μια καινούρια επιλογή για INSTI προθεραπευμένους ασθενείς, αλλά απαιτεί χορήγηση δις ημερησίως σε ανίχνευση INSTI αντοχής
