AIDS
advertisement
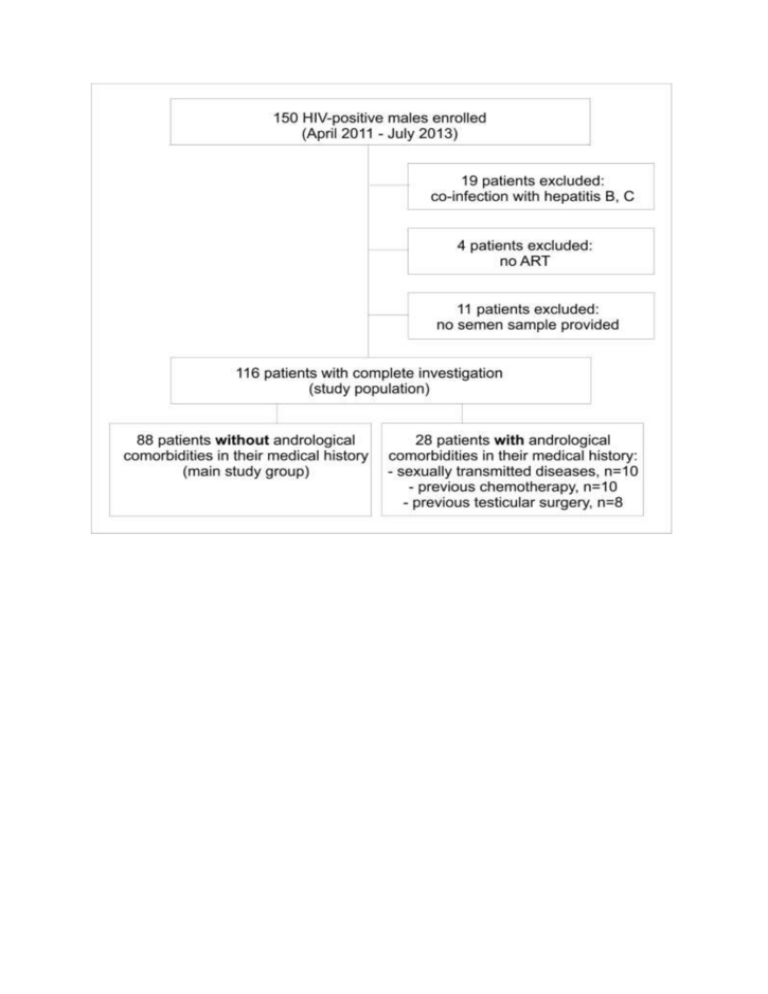
Table S1. Semen parameters of patients and controls undergoing sperm proteome analysis HIV-positive patients, n=15, median (range) Controls, n=15 median (range) pb 42 (26 - 49) 37 (27 - 58) 0.595 TDF/FTC/EFV 3 n.a. n.a. TDF/FTC/RLP 1 n.a. n.a. RAL/TDF/FTC 2 n.a. n.a. DRV/RTV/TDF/FTC 2 n.a. n.a. LPV/RTV/TDF/FTC/ABC 1 n.a. n.a. ATV/RTV/TDF/FTC 1 n.a. n.a. fAPV/RTV/TDF/FTC 1 n.a. n.a. NVP/TDF/FTC 2 n.a. n.a. NVP/ABC/3TC 2 n.a. n.a. 4 (2.4 - 6.0) 3.3 (1.7 - 7.1) 0.116 Parameter Patient age [years] ART therapy Semen volume [ml] Semen pH Sperm concentration [106/ml] Progressive motility [%] a Normal morphology [%] 6 7.8 (7.3 - 8.5) 7.7 (7.3 - 8.3) 0.285 71.0 (25.8 - 425.0) 58.0 (19.4 - 194.0) 0.653 52 (25 - 77) 52 (9 - 72) 0.806 3.0 (0 - 9) 7.0 (2 - 24) 0.013 Peroxidase -positive leukocytes [10 /ml] 0.1 (0 - 0.6) 0.1 (0 - 8.9) 0.683 Seminal elastase [ng/ml] 84 (10 - 965) 68 (13 - 2000) 0.775 1 1 n.a. 75 (35 - 97) 79 (50 - 92) 0.806 6 c Spermatozoa for proteome analysis [10 ] Progressive motility in swim-up samples [%] a using strict criteria, bMann-Whitney U test, c1×106 sperms were taken from each patient to standardize protein concentration, n.a. not applicable Table S2. Characteristics of the study populationa Parameter Age (years) Patients without comorbitities (n=88) Patients with comorbitities (n=28) 43 (18 - 64) 47 (24 - 61) Duration of HIV infection (years) 5 (0 - 33) 8.5 (0 - 28) Time on ART (years) 4 (0 - 20) 7 (0 - 17) 3 59 (67.0%) 16 (57.1%) 4 23 (26.1%) 10 (35.7%) 5 6 (6.8%) 2 (7.1%) 548.5 (23 - 1536) 449.5 (98 - 1151) 81 (92%) 25 (89.3%) 7 (8%) 3 (10.7%) 80212 (7542 - 6000000) 38371 (919 - 750000) 233 (3 - 762) 138.5 (4 - 461) A 24 (27.3%) 5 (17.9%) B 27 (30.7%) 10 (35.7%) C 37 (42%) 13 (60.7%) 1 5 (5.7) 1 (3.6%) 2 43 (48.9) 10 (35.7%) 3 40 (45.5) 17 (60.7%) heterosexual 30 (34.1%) 10 (35.7%) homosexual 45 (51.1%) 16 (57.1%) bisexual 13 (14.8%) 2 (7.1%) 49 (55.7%) 14 (50%) 50 (1 - 5000) 50 (5 - 1500) 23 (26.1%) 5 (17.9%) FSH (mU/ml) 5.6 (1.5 - 23.4) 8.2 (0.6 - 72.5) LH (mU/ml) 5.5 (2 - 30.1) 4.6 (0.1 - 47.1) Testosterone (ng/dl) 505.5 (213 - 1006) 442 (79 - 1020) Free Testosterone (ng/dl) 8.1 (3.15 - 20.23) 7.9 (0.9 - 14.7) Prolactin (uIU/ml) 147 (59 - 1206) 133.5 (34 - 301) Oestradiol (pg/ml) 31 (12 - 66) 32 (12-50) 43.3 (19.5 - 124) 47.5 (21.7 - 99.5) 12.7 (4.6 - 25.6) 12.9 (3.4 -22.3) current 38 (43.2%) 13 (46.4%) previous 12 (13.6%) 6 (21.4%) Total 50 (56.8%) 18 (64.3%) never 21 (23.9%) 4 (14.3%) scarce 26 (29.5%) 11 (39.3%) Number of current ART drugs Present CD4 count (cells/µl) Viral load in blood below detection limit detectable Highest known viral load (copies/ml) CD4 nadir (cells/µl) CDC stage Sexual orientation Current partner Number of lifetime sexual partners Patients with own children Hormonesb SHBG (nmol/l) Mean testicular volume (ml) Smokers Alcohol consumption occasional 26 (29.5%) 9 (32.1%) often 11 (12.5%) 2 (7.1%) daily 4 (4.5%) 2 (7.1%) current 12 (13.6%) 5 (17.9%) previous 21 (23.9%) 6 (21.4%) Total 26 (29.5%) 7 (25.0%) Drug abuse a data are expressed either as median (range) or, when categorical, as absolute numbers and percentages b measured between 8 and 10 a.m. Table S3. Correlation between semen parameters and markers of HIV disease CD4 cell count (n=88) CDC Status (n=88) Duration of disease (n=88) Duration of ART (n=88) Positive viral loada (n=88) ABC 123 r, p r, p r, p r, p r, p p Volume (ml) NS NS NS NS NS NS pH value NS NS r=0.239, p=0.026 NS NS NS NS NS NS NS NS NS Total sperm count (10 ) NS NS NS NS NS NS Progressive motility (%) NS NS NS NS NS NS Sperm vitality (%) NS NS NS NS r=-0.228, p=0.037 NS Normal morphology (%) NS NS NS NS NS NS Alpha-glucosidase (mU/ejaculate) NS NS NS NS NS NS Fructose (µmol/ejaculate) NS NS NS NS NS NS Zinc (µmol/ejaculate) NS NS NS NS NS NS Peroxidase+ leukocytes (10 /ml) NS NS NS NS r=0.228, p=0.033 NS Elastase (ng/ml) NS r=0.239, p=0.038 NS NS NS NS 6 Sperm concentration (10 /ml) 6 6 a Mann-Whitney U test, NS not significant, bscore calculated according to [23] N Table S4. Sperm protein alterations in HIV-positive patientsa Protein name Protein accession number MW [kDa] Peptides Sequence coverage [%] Mascot score Regulation fact patients/control 3523 FRMD4A FERM domain-containing protein 4A IPI00514952 60.2 6 16.8 62.4 0.01 3526 ACPP Prostatic acid phosphatase IPI00396434 44.5 11 26.7 102.0 0.35 3617 KRT10 Keratin, type I cytoskeletal 10 IPI00009865 58.8 17 29.3 116.0 0.16 3619 HSPA1A Heat shock 70 kDa protein 1A/1B IPI00304925 70.0 11 22.0 69.3 0.06 3622 HSPA1A Heat shock 70 kDa protein 1A/1B IPI00304925 70.0 9 18.7 64.6 0.08 4305 HSPB1 Heat shock protein beta-1 IPI00025512 22.8 9 59.0 109.0 0.32 4406 ANXA3 Annexin A3 IPI00024095 36.4 16 48.3 164.0 0.02 CKB Creatine kinase B-type IPI00022977 42.6 8 27.6 70.1 CKB Creatine kinase B-type IPI00908811 38.7 7 26.6 73.7 Serum albumin IPI00022434 71.7 13 22.6 85.1 KRT10 Keratin, type I cytoskeletal 10 IPI00009865 58.8 13 21.6 83.3 KRT9 Keratin, type I cytoskeletal 9 IPI00019359 62.0 13 23.4 92.5 5301 PRDX6 Peroxiredoxin-6 IPI00220301 25.0 8 41.1 83.7 0.02 5402 KRT10 Keratin, type I cytoskeletal 10 IPI00009865 58.8 9 19.2 65.3 0.48 5502 KRT10 Keratin, type I cytoskeletal 10 IPI00009865 58.8 10 16.4 86.0 0.14 5508 KRT10 Keratin, type I cytoskeletal 10 IPI00009865 58.8 10 19.2 76.4 0.29 KRT10 Keratin, type I cytoskeletal 10 IPI00009865 58.8 19 30.0 135.0 KRT1 Keratin, type II cytoskeletal 1 IPI00220327 66.0 17 25.9 90.2 KRT10 Spot name 4502 Gene name 4608 ALB 4610 5610 a 0.24 0.28 0.16 0.18 Keratin, type I cytoskeletal 10 IPI00009865 58.8 17 30.5 122.0 5705 KRT6C Keratin, type II cytoskeletal 6C IPI00299145 60.0 14 24.5 80.9 KRT6C Keratin, type II cytoskeletal 6C IPI00930073 60.0 14 24.6 82.3 6406 SORD Sorbitol dehydrogenase IPI00216057 38.3 11 29.7 110.0 0.35 6410 ANXA1 Annexin A1 IPI00218918 38.7 9 32.9 78.2 0.04 6411 SORD Sorbitol dehydrogenase IPI00216057 38.3 10 26.6 92.4 0.39 Protein name: name of each protein in human IPI database. Protein accession number: IPI database accession number. MW: theoretical molecular weight of identified proteins in kDa. Peptides: number of peptides matched to candidate protein. Sequence coverage: percentage of identified sequence in relation to complete sequence of known protein. Regulation factor: densitometric ratio between spots in patient samples compared to respective spots in the control gels. Significance level for regulation was higher than 95% for all spots. 0.05
