Graphing Motion Lab 2
advertisement

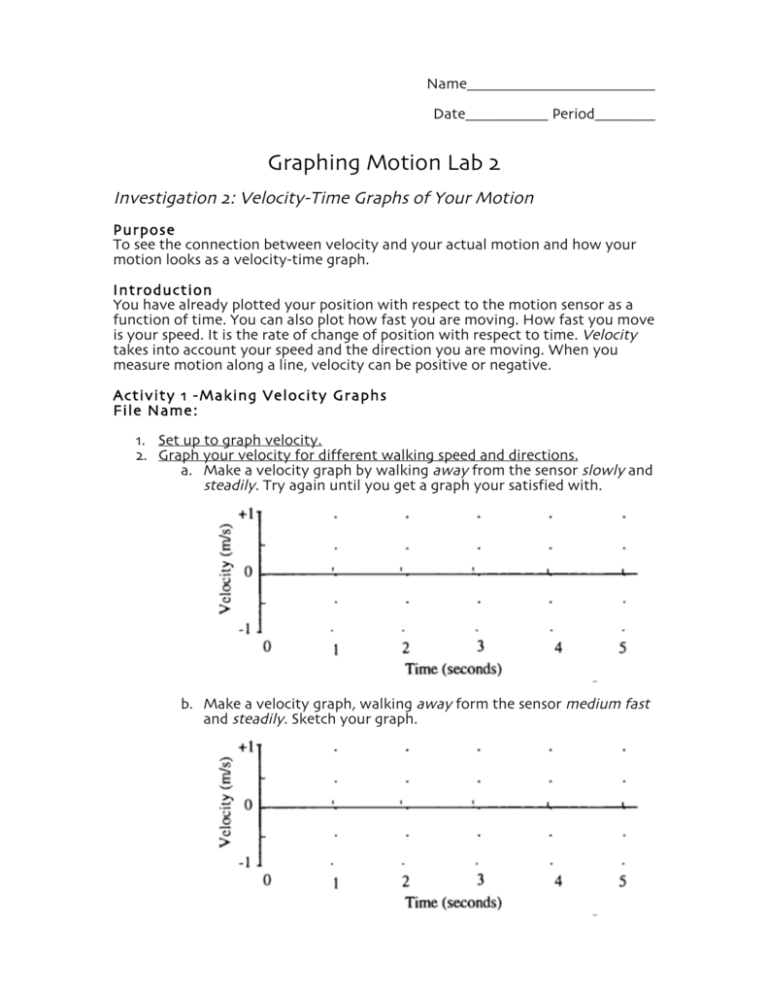
Name_________________________ Date___________ Period________ Graphing Motion Lab 2 Investigation 2: Velocity-Time Graphs of Your Motion Purpose To see the connection between velocity and your actual motion and how your motion looks as a velocity-time graph. Introduction You have already plotted your position with respect to the motion sensor as a function of time. You can also plot how fast you are moving. How fast you move is your speed. It is the rate of change of position with respect to time. Velocity takes into account your speed and the direction you are moving. When you measure motion along a line, velocity can be positive or negative. Activity 1 -Making Velocity Graphs File Name: 1. Set up to graph velocity. 2. Graph your velocity for different walking speed and directions. a. Make a velocity graph by walking away from the sensor slowly and steadily. Try again until you get a graph your satisfied with. b. Make a velocity graph, walking away form the sensor medium fast and steadily. Sketch your graph. c. Make a velocity graph, walking toward the sensor slowly and steadily. Sketch your graph. d. Make a velocity graph, walking toward the sensor medium fast and steadily. Sketch your graph. Questions What is the most important difference between the graph made by slowly walking away from the sensor and the one made by walking away more quickly? (Q1) How are the velocity-time graphs different for motion away and motion toward the sensor? (Q2) 3. Predict a velocity graph for a more complicated motion and check your prediction. a. Each person draw below, using a dotted line, your prediction of the velocity graph produced if you— • Walk away from the sensor slowly and steadily for 10 seconds • Stop for 4 seconds • Walk toward the sensor steadily about twice as fast as before b. Compare your predictions and see if you can all agree. Use a solid line to draw in your group prediction. PREDICTION 4. Do the experiment. (Be sure to adjust the time scale to 20 seconds. To do this change axes limit to 20 seconds by clicking on axes labels.) Repeat your motion until you think it matches the description. Draw the best graph on the axes below. Be sure the 4-second stop shows clearly. FINAL RESULT Comment How fast you move is your speed, the rate of change of position with respect to time. Velocity implies both speed and direction. As you have seen, for motion along a line (the positive x axis) the sign (+ or -) of the velocity indicates the direction. If you move away form the sensor (origin), your velocity is positive, and if you move toward the sensor, your velocity is negative. The faster you move away from the origin, the larger positive number your velocity is. The faster you move toward the origin, the “larger” negative number you velocity is. That is -4 m/s is twice as fast as -2 m/s and both motions are toward the origin. Activity 2— Matching a Velocity Graph In this activity, you will move to match a velocity graph shown on the computer screen. File Name: Stamp goes here! 1. Display the velocity graph on the screen. 2. Move so as to imitate this graph. You may try a number of times. Work as a team and plan your movements. Get the times right, Get the velocities right. Each person should take a turn. Draw in your group’s best match on the axis above. Questions Describe how you moved to match each part of the graph. (Q3) Is it possible for an object to move so that it produces an absolutely vertical line on a velocity time graph? Explain. (Q4) Investigation 3: Position and Velocity Graphs To find out The relationship between position-time and velocity-time graphs. Introduction You have looked at position and velocity-time graphs separately. Now you will see how they are related. Activity 1— Predicting Velocity Graphs from Position Graphs File Name: 1. Set up to graph Position and Velocity. 2. Predict a velocity graph from a position graph. Carefully study the position graph shown below and predict the velocity-time graph that would result from the motion. Using a dotted line, sketch your prediction of the corresponding velocity-time graph on the velocity axes. 3. Make the graphs. After each person has sketched a prediction, Start, and do your group’s best to make a position graph like the one shown below. Walk as smoothly as possible. When you have made a good duplicate of the position graph, sketch your actual graph over the existing position-time graph. Use a solid line to draw the actual velocity graph on the same graph with you prediction. (Do not erase your prediction.) Questions How would the position graph be different if you moved faster? Slower? (Q1) How would the velocity graph be different if you moved faster? Slower? (Q2 Activity 2— Predicting Position Graphs from Velocity Graphs File Name: 1. Predict a position-time graph from a velocity-time graph. Carefully study the velocity graph below. Using a dotted line, sketch your prediction of the corresponding position graph on the bottom of the axes. (Assume that you started at the 1-meter mark.) 2. Make the graphs. After each person has sketched a prediction do your group’s best to duplicate the top (velocity-time) graph by walking. (Reset the Time axis to 0 to 10 sec before you start.) When you have made a good duplicate of the velocity-time graph, draw your actual result over the existing velocity-time graph. Use a solid line to draw the actual position-time graph on the same axes with your prediction. (Do not erase your prediction.) Questions How can you tell from a velocity-time graph that the moving object has changed direction? (Q5) What is the velocity at the moment the direction changes? (Q6) Is it possible to move your body (or an object) to make the vertical lines on the velocity graph you were trying to match? Why or why not? (Q7) Is it possible to actually move your body (or an object) to make vertical lines on a position-time graph? Why or why not? What would the velocity be for a vertical section of a position-time graph? (Q8) How can you tell from a distance-time graph that your motion is steady (motion at a constant velocity)? (Q9) How can you tell from a velocity-time graph that your motion is steady? (Q10) Follow-up Graphs Draw qualitative graphs of a) position-time b) velocity-time for the following types of motion. •Stopped motion •Constant forward (away from the sensor) motion. •Constant reverse (toward the sensor) motion. •Make up your own graphs. Describe the motion below:


