Treasury Yield Curve (percent)
advertisement
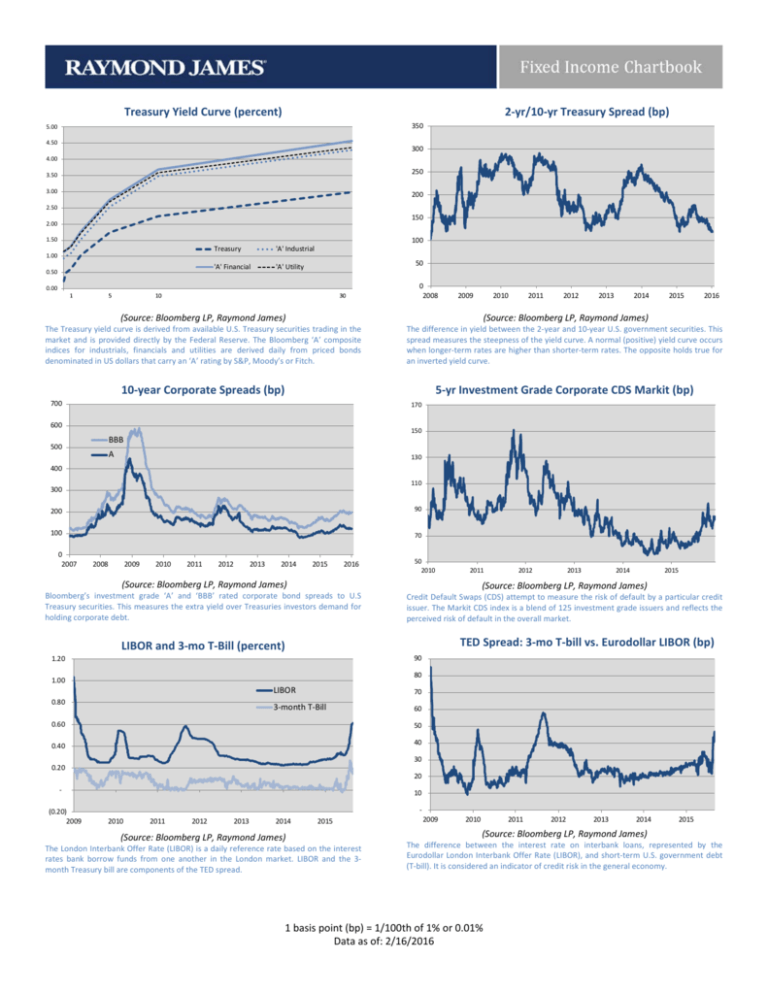
2-yr/10-yr Treasury Spread (bp) Treasury Yield Curve (percent) 350 5.00 4.50 300 4.00 250 3.50 3.00 200 2.50 150 2.00 100 1.50 1.00 0.50 Treasury 'A' Industrial 'A' Financial 'A' Utility 50 0 2008 0.00 (Source: Bloomberg LP, Raymond James) The Treasury yield curve is derived from available U.S. Treasury securities trading in the market and is provided directly by the Federal Reserve. The Bloomberg ‘A’ composite indices for industrials, financials and utilities are derived daily from priced bonds denominated in US dollars that carry an ‘A’ rating by S&P, Moody’s or Fitch. 2009 2010 2011 2012 2013 2014 2015 2016 (Source: Bloomberg LP, Raymond James) The difference in yield between the 2-year and 10-year U.S. government securities. This spread measures the steepness of the yield curve. A normal (positive) yield curve occurs when longer-term rates are higher than shorter-term rates. The opposite holds true for an inverted yield curve. 10-year Corporate Spreads (bp) 5-yr Investment Grade Corporate CDS Markit (bp) 700 170 600 150 BBB 500 A 130 400 110 300 200 90 100 70 0 2007 2008 2009 2010 2011 2012 2013 2014 2015 2016 50 2010 2011 (Source: Bloomberg LP, Raymond James) Bloomberg’s investment grade ‘A’ and ‘BBB’ rated corporate bond spreads to U.S Treasury securities. This measures the extra yield over Treasuries investors demand for holding corporate debt. 1.20 2013 2014 2015 Credit Default Swaps (CDS) attempt to measure the risk of default by a particular credit issuer. The Markit CDS index is a blend of 125 investment grade issuers and reflects the perceived risk of default in the overall market. TED Spread: 3-mo T-bill vs. Eurodollar LIBOR (bp) LIBOR and 3-mo T-Bill (percent) 90 80 1.00 0.80 LIBOR 70 3-month T-Bill 60 0.60 50 0.40 40 30 0.20 20 (0.20) 2009 2012 (Source: Bloomberg LP, Raymond James) 10 2010 2011 2012 2013 2014 (Source: Bloomberg LP, Raymond James) 2015 The London Interbank Offer Rate (LIBOR) is a daily reference rate based on the interest rates bank borrow funds from one another in the London market. LIBOR and the 3month Treasury bill are components of the TED spread. 2009 2010 2011 2012 2013 2014 (Source: Bloomberg LP, Raymond James) 2015 The difference between the interest rate on interbank loans, represented by the Eurodollar London Interbank Offer Rate (LIBOR), and short-term U.S. government debt (T-bill). It is considered an indicator of credit risk in the general economy. 1 basis point (bp) = 1/100th of 1% or 0.01% Data as of: 2/16/2016 BBB Corporate Yields (percent) A Corporate Yields (percent) 5.00 6.00 4.00 5.00 4.00 3.00 3.00 2.00 1.00 Feb '16 Feb '15 Aug '15 Aug '14 2.00 Feb '16 Aug '15 1.00 Feb '15 Aug '14 0.00 0.00 (Source: Bloomberg LP, Raymond James) The charts above are the U.S. dollar denominated, domestic A and BBB composite curves for investment grade corporate bonds. Each curve attempts to indicate prevailing yields within each specific credit-quality. Municipal AAA Maturity Spread - MMD Municipal AAA Yield Curve - MMD 3.50 250 3.00 200 2.50 150 2.00 1.50 100 2/12/2016 1.00 10 minus 5 50 8/14/2015 0.50 30 minus 10 2/12/2015 - 1-yr 5-yr 10-yr 20-yr 2009 30-yr 2010 2011 2012 2013 2014 2015 2016 (Source: MMD, Bloomberg, LP, Raymond James) (Source: MMD, Bloomberg LP, Raymond James) The graph depicts the relationship between yields and maturity for AAA rated municipal bonds. AAA Municipal Market Data (MMD) Scale represents an average of where the universe of AAA paper may have traded on a particular day. The AAA MMD scale is accepted as the benchmark scale. The difference in yield between the 5-year and 10-year Municipal AAA MMD as well as the difference in yield between the 10-year and 30-year. These spreads measure the steepness of the yield curve as well as the yield pick-up for extending maturity. A normal yield curve (positive) occurs when longer-term rates are higher than shorter-term rates. The opposite holds true for an inverted yield curve. Total Municipal Debt Issuance ($billions) Historic AAA Municipal to Treasury Ratio - MMD 180 600 160 500 600 459 417 140 488 450 433 474 499 500 428 374 400 329 120 399 400 358 300 300 200 200 100 100 100 80 60 40 2009 5-Yr 2010 2011 2012 2013 10-Yr 2014 30-Yr 2015 (Source: MMD, Bloomberg LP, Raymond James) 2016 Ratio of the AAA MMD yield to the corresponding U.S. Treasury. he higher the muniTreasury ratio, the more attractive munis are relative to Treasuries. - 2004 2005 2006 2007 2008 2009 2010 2011 2012 2013 (Source: Bloomberg LP, Raymond James) Total issuance of U.S. municipal debt by calendar year. 1 basis point (bp) = 1/100th of 1% or 0.01% Data as of: 2/16/2016 2014 2015 Corporate Sector Spreads to Treasuries (bp) 250 "BBB Industrials" "BBB Financials" "A" Industrials "A Financials" 200 "A Banks" "A Utilities" "BBB Banks" "BBB Utilities" 150 100 50 0 3-mo 6-mo 1-yr 2-yr 5-yr 10-yr 30-yr (Source: Bloomberg LP, Raymond James) The amount of extra yield, in basis points, that investors require to own corporate ‘A’ and “BBB” credit-quality bonds over U.S. Treasury securities. Investment Company Institute (ICI) Flows of Long-term Funds 20,000 2,800 2,750 15,000 2,700 10,000 2,650 5,000 2,600 0 2,550 2,500 -5,000 -10,000 -15,000 2,450 Total Equity (mil) Taxable Bond (mil) Total Bond (mil) Money Market (bil: right) 2,400 2,350 (Source: ICI, Raymond James) Total estimated inflows to long-term mutual funds. Flow estimates are derived from data collected from over 95% of industry assets. Total Issuance of U.S. Corporate Debt Issuance ($Billions) 2010 2011 2012 2013 2014 2015 Series7 1,750 1,500 1,250 1,000 750 500 250 0 Jan Feb Mar Apr May Jun Jul Aug (Source: Bloomberg, Raymond James) Sep Oct Total issuance of U.S. dollar denominated public and private (144a) corporate bonds sold globally. 1 basis point (bp) = 1/100th of 1% or 0.01% Data as of: 2/16/2016 Nov Dec Fixed Income “Heat Map”: Index Returns and Yields Index Returns QTD YTD Avg. Mat # Issues Last Week M/M Citi Broad IG Corp. Index 10.44 5,786 -0.21% 0.22% 0.08% 0.08% Industrials 11.16 3,384 -0.11% 0.08% -0.08% -0.08% 0.06% 0.81% 0.58% 0.58% 1,105 Manufacturing 9.95 Aero/Defense 12.12 87 0.14% 2.68% 2.51% 2.51% Automobile 6.06 96 -0.21% -0.11% -0.33% -0.33% Building Prods 10.54 25 -0.46% 1.44% 1.16% 1.16% Chemicals 11.64 155 0.19% 0.84% 0.48% 0.48% 10.28 162 0.05% 1.55% 1.49% 1.49% Conglom/Div Mfg -0.05% 0.51% 0.38% 0.38% 126 Electronics 8.20 Info Tech 10.59 173 0.23% 1.18% 1.00% 1.00% Machinery 7.15 91 0.09% 1.67% 1.25% 1.25% Metals/Mining 11.70 107 0.07% -1.78% -2.21% -2.21% Paper/Forest Prod 12.07 38 -0.54% -0.42% -0.71% -0.71% Textiles/Apparel 18.54 7 1.06% 4.12% 3.79% 3.79% Vehicle Parts 12.93 24 0.49% 2.19% 2.12% 2.12% Other Manf 10.01 10 0.10% 1.76% 1.74% 1.74% 11.15 681 -1.28% -5.28% -5.30% -5.30% Energy Gas-Pipelines 12.64 277 -1.27% -3.82% -3.82% -3.82% Oil & Gas 10.09 332 -1.05% -5.15% -5.17% -5.17% -2.99% -11.35% -11.40% -11.40% Machinery & Svs 12.60 72 Service 12.06 1,039 0.18% 1.47% 1.29% 1.29% Cable/Media 13.55 198 -0.01% 0.38% 0.03% 0.03% 33 -0.37% 0.73% 0.70% 0.70% Gaming/Lodging 6.32 Healthcare 9.91 153 0.29% 1.60% 1.50% 1.50% 11.49 233 0.34% 1.88% 1.65% 1.65% Pharma Publishing 9.46 13 0.01% 1.53% 1.45% 1.45% Restaurants 12.82 30 0.67% 1.70% 1.87% 1.87% 0.38% 2.36% 2.20% 2.20% Retail - Food/Drugs 11.37 53 Retail - Stores/Other 11.90 165 -0.07% 1.09% 1.03% 1.03% Service - Other 14.62 159 0.20% 2.43% 2.33% 2.33% 0.05% 1.43% 1.24% 1.24% Transportation 15.07 210 Airlines 6.25 35 -0.73% -0.35% -0.45% -0.45% 18.80 127 0.24% 1.91% 1.65% 1.65% Railroads 0.12% 1.48% 1.38% 1.38% Trans - Other 11.97 48 Consumer 10.64 349 0.30% 2.36% 2.28% 2.28% Beverage/Bottling 10.88 115 0.28% 2.15% 2.26% 2.26% Consu Prod 8.60 86 0.16% 2.49% 2.16% 2.16% Food 10.10 98 0.34% 2.50% 2.36% 2.36% Tobacco 12.34 50 0.40% 2.40% 2.27% 2.27% Utilities 14.68 914 0.29% 2.00% 1.94% 1.94% Electric 14.80 685 0.59% 3.15% 3.20% 3.20% 0.11% 3.53% 2.90% 2.90% Gas- Local Dist 16.29 42 10.07 28 0.94% -1.57% -1.05% -1.05% Power 148 -0.13% 0.63% 0.41% 0.41% Telecomm 14.73 Utility - Other 13.34 11 -0.36% 1.23% 2.38% 2.38% Finance 7.47 1,488 -0.60% -0.22% -0.37% -0.37% Banking 6.59 718 -0.71% -0.51% -0.65% -0.65% Finance - Other 5.76 113 -0.43% -0.20% -0.22% -0.22% Ind. Finance 11.63 11 0.32% 1.67% 1.23% 1.23% Lease Finance 3.24 10 -1.43% -2.52% -2.53% -2.53% -0.14% -0.02% -0.25% -0.25% Life Insurance 12.93 183 Prop & Casualty 12.38 136 0.15% 1.37% 1.27% 1.27% REITs 7.11 278 -0.91% 0.63% 0.44% 0.44% Securities 7.59 39 -0.28% 0.42% 0.52% 0.52% Index Yields (in percent) 1-yr Last Week Mo. Ago Beg. Qtr Beg. Year Year Ago 3.56 3.60 3.60 2.96 3.65 -2.15% 3.12 3.86 3.86 -3.49% 3.89 3.83 2.91 3.68 -2.21% 3.59 3.61 3.68 1.51% 3.23 3.35 3.48 3.48 2.83 -1.34% 3.17 3.07 3.06 3.06 2.38 4.01 4.02 4.02 3.22 2.12% 3.97 3.82 3.82 3.04 3.82 3.77 -3.33% 2.71 3.14 0.26% 2.86 2.92 3.14 -1.24% 3.37 3.31 3.45 3.45 2.57 0.57% 3.08 3.11 3.21 3.21 2.57 0.76% 2.49 2.60 2.68 2.68 2.18 7.10 6.55 6.55 4.11 7.16 -14.78% 4.47 3.62 4.47 4.37 -2.37% 4.55 2.41% 3.26 3.46 3.54 3.54 3.00 -2.48% 4.06 4.20 4.14 4.14 3.47 0.40% 3.92 4.06 4.17 4.17 3.64 3.82 -14.27% 6.03 5.30 5.08 5.08 6.07 6.07 3.83 6.83 6.25 -16.37% 4.45 3.61 -12.44% 5.32 4.63 4.45 5.00 -19.65% 8.08 6.48 5.87 5.87 3.49 3.58 3.58 3.01 -0.07% 3.44 3.29 -3.81% 4.17 4.15 4.17 4.17 3.73 3.73 3.73 3.74 3.77 0.92% 3.24 2.78 3.24 1.29% 3.09 3.12 0.98% 3.28 2.74 3.09 3.21 3.28 3.61 3.74 3.74 3.21 0.46% 3.55 3.60 2.78 -1.38% 3.29 3.47 3.60 3.54 3.11 0.97% 3.34 3.42 3.54 3.36 3.39 3.46 3.46 2.97 0.10% 3.80 3.80 3.23 1.99% 3.54 3.59 -1.06% 3.54 3.59 3.65 3.65 3.07 3.63 3.57 3.57 3.01 0.64% 3.74 3.19 -1.92% 3.66 3.73 3.81 3.81 3.19 3.30 3.30 2.84 0.02% 3.10 3.12 3.12 2.68 2.33% 2.97 3.01 2.85 2.41 2.13% 2.92 2.74 2.85 2.61 2.73 2.86 2.86 2.46 2.17% 3.39 3.39 2.94 2.17% 3.12 3.28 3.07 2.88% 3.18 3.34 3.47 3.47 -1.20% 3.70 3.78 3.86 3.86 3.23 3.52 3.63 3.63 3.03 -0.44% 3.37 -2.24% 3.69 3.86 3.95 3.95 3.41 4.30 3.53 -5.21% 4.58 4.44 4.30 4.13 4.13 3.45 -1.95% 4.09 4.08 2.09% 3.55 3.64 3.74 3.74 3.13 3.06 3.06 2.57 -0.09% 3.18 3.00 2.41 -0.07% 3.02 2.83 2.88 2.88 2.92 2.92 2.41 0.12% 3.08 2.79 3.48 3.44 3.11 3.11 2.51 1.44% 3.25 3.25 2.84 -1.05% 4.16 3.12 -2.04% 3.64 3.60 3.63 3.63 3.13 3.73 3.73 3.18 0.03% 3.64 3.60 1.00% 3.58 3.48 3.56 3.56 2.99 1.28% 3.50 3.40 3.55 3.55 3.03 (Source: YieldBook, Raymond James) Index returns are total return. The “Heat Map” is arranged by column and indicates a scale of the largest values (green) to the smallest values (red). Data as of: 2/16/2016 All investing involves risk and you may incur a profit or a loss. Past performance is not a guarantee of future results. This material is for informational purposes only and should not be used or construed as a recommendation regarding any security. Indices are unmanaged and cannot accommodate direct investments. An individual who purchases an investment product which attempts to mimic the performance of an index will incur expenses such as management fees and transaction costs which reduce returns. Returns are cumulative total return for stated period, including reinvestment of dividends. For more information, see next page. Disclosures: Investors should discuss the risks inherent in bonds with their Raymond James Financial Advisor. Past performance is no assurance of future results. Diversification and asset allocation do not ensure a profit or protect against a loss. Investments are subject to market risk, including possible loss of principal. This communication is intended to improve the efficiency with which Financial Advisors obtain information relevant to their client's taxable fixed income holdings. This information should not be construed as a directive from the RJ&A Taxable Fixed Income Department to buy or sell the securities noted above. Prior to transacting in any security, investors are urged to discuss the suitability, potential returns, and associated risks of the transactions(s) with their Raymond James Financial Advisor. The information contained herein has been prepared from sources believed reliable but is not guaranteed by Raymond James & Associates, Inc. (RJA) and is not a complete summary or statement of all available data, nor is it to be construed as an offer to buy or sell any securities referred to herein. Trading ideas expressed are subject to change without notice and do not take into account the particular investment objectives, financial situation or needs of individual investors. Investors are urged to obtain and review the relevant documents in their entirety. RJA is providing this communication on the condition that it will not form the primary basis for any investment decision you may make. Furthermore, because these are only trade ideas, investors should assume that RJA will not produce any follow-up. Employees of RJA or its affiliates may, at times, release written or oral commentary, technical analysis or trading strategies that differ from the opinions expressed within. RJA and/or its employees involved in the preparation or the issuance of this communication may have positions in the securities discussed herein. Securities identified herein are subject to availability and changes in price. All prices and/or yields are indications for informational purposes only. Additional information is available upon request. A credit rating of a security is not a recommendation to buy, sell or hold securities and may be subject to review, revisions, suspension, reduction or withdrawal at any time by the assigning rating agency. All corporate fixed income index data provided by the Citi US Broad Investment Grade Bond Index (BIG) and its associated sub-indices. Inclusion in this index requires a stated coupon that is fixed, a minimum maturity of one year. US Treasuries: US$5 billion public amount outstanding, US agencies and supranationals: US$1 billion, Corporate and asset-backed: US$250 million, Mortgage: Entry: US$1 billion minimum amount outstanding per origination year generic when the coupon has a minimum amount outstanding of US$5 billion. Exit: An origination year generic will exit when its amount outstanding falls below US$1 billion. If the amount outstanding for the coupon falls below US$2.5 billion, all corresponding origination year generics will be removed from the index. Minimum quality is BBB-/Baa3 by either S&P or Moody's. The Citigroup US BIG Corporate Index is a sub-index of the Citi BIG Index and follows the same parameters listed above but restricts securities to US and non-US corporate securities (excludes U.S. Government Guaranteed and Non-US sovereign and provincial securities). Corporate industry sector classifications are based on Citi's proprietary Global Industry Code (GLIC) and Corporate Bond Sector Code (COBS) profiles which are derived from the North American Industry Classification System (NAICS). NAICS is the industry standard used by Federal statistical agencies in classifying business establishments for the purpose of collecting, analyzing and publishing statistical data related to the US business economy Index returns do not reflect the deduction of fees, trading costs or other expenses. The Index is referred to for informational purposes only; the composition of each Index is different from the composition of the accounts managed by the investment manager. Investors may not make direct investments into any index. Past performance may not be indicative of future results. There is an inverse relationship between interest rate movements and fixed income prices. Generally, when interest rates rise, fixed income prices fall and when interest rates fall, fixed income prices rise. U.S. Treasury bills are guaranteed by the U.S. government and, if held to maturity, offer a fixed rate of return and guaranteed principal value. Treasury bills are certificates reflecting short-term obligations of the U.S. government. Municipal Market Data (MMD) generic curves evaluate non-AMT blocks of $2mln or more and assume a 10-year PAR call and a 5.00% coupon structure. Raymond James & Associates, Inc., member New York Stock Exchange/SIPC. Raymond James Financial Services, Inc., member FINRA/SIPC. Ref. 2015-052661 until 12/10/2016 © 2015 Raymond James & Associates, Inc., member New York Stock Exchange/SIPC © 2015 Raymond James Financial Services, Inc., member FINRA/SIPC Raymond James Corporate Headquarters ● 880 Carillon Parkway, St. Petersburg, FL 33716 Data as of: 2/16/2016
