Reactions and Separations
Calculating the Capacity
of Chemical Plants
Russell A. Ogle, P.E.
Andrew R. Carpenter, P.E.
Exponent, Inc.
Production capacity is a vital statistic for describing the
performance of a chemical plant, but there is no
universally accepted definition or means to evaluate it.
This article provides a comprehensive definition
of capacity and details the options for deriving it.
T
he production capacity of a chemical plant is a
fundamental measure of its economic potential, and
an integral factor in the assessment of a chemical
plant’s value. Although capacity is a central concept in
production planning and scheduling, operations management and chemical engineering literature do not offer a
cohesive explanation or means for determining it. This
article provides this missing insight with a definition and
description of capacity that encompasses the various disparate descriptions offered, as well as a means to calculate
and evaluate it.
Production system performance
A production system transforms inputs of raw materials, energy, and labor into product outputs. This system can
be decomposed into processing steps that occur in process
equipment and inventory buffers such as storage tanks,
hoppers, and silos.
The performance of a single processing step can be
evaluated in terms of the material throughput, equivalent
to the mass flowrate; the work-in-process (WIP), described
as the mass of material within the processing equipment;
and the flowtime, calculated by dividing the WIP by the
throughput. For the production of continuous entities such
as solids, liquids, and gases, the link between the throughput, WIP, and flowtime is the mass balance. For discrete
entities such as manufactured goods, this relationship is
described by queueing theory (sometimes considered to
be a branch of operations research), and more specifically
by Little’s Law, which states that the WIP is equal to the
Copyright © 2014 American Institute of Chemical Engineers (AIChE)
maximum throughput multiplied by the flowtime (1).
A simple definition of capacity is the maximum throughput for a single processing step. (Subsequent sections
discuss the important subtleties that this definition ignores,
but for the moment, this will suffice.) For chemical manufacturing operations, the production system usually takes
the form of a series of processing steps; this is referred to as
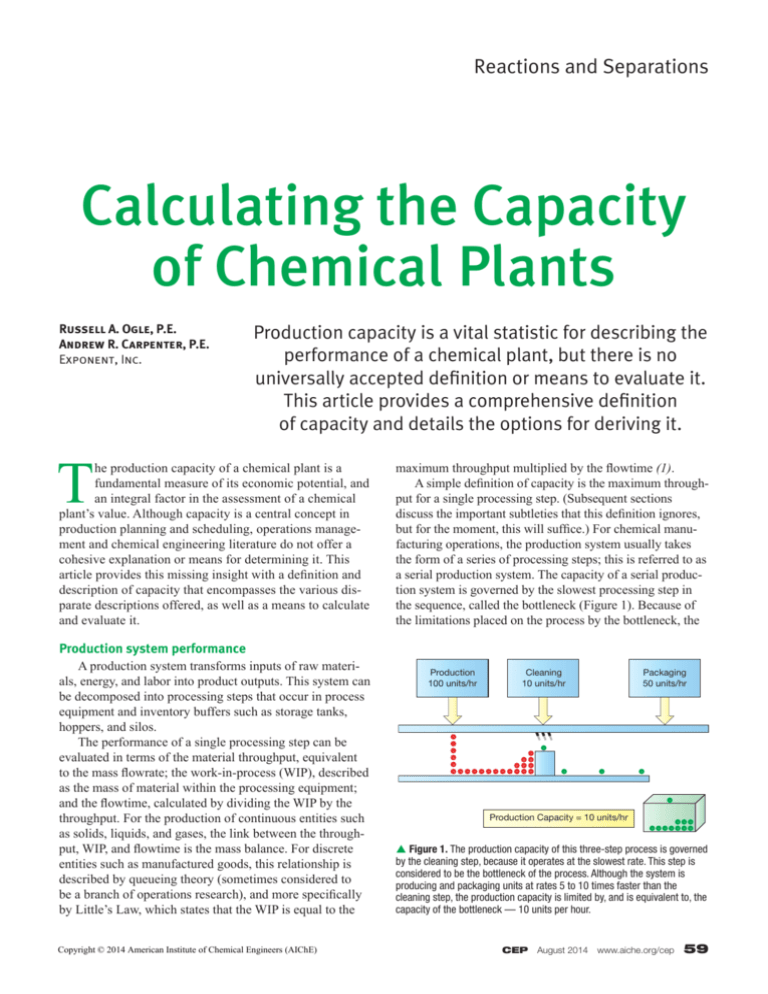
a serial production system. The capacity of a serial production system is governed by the slowest processing step in
the sequence, called the bottleneck (Figure 1). Because of
the limitations placed on the process by the bottleneck, the
Production
100 units/hr
Cleaning
10 units/hr
Packaging
50 units/hr
Production Capacity = 10 units/hr
p Figure 1. The production capacity of this three-step process is governed
by the cleaning step, because it operates at the slowest rate. This step is
considered to be the bottleneck of the process. Although the system is
producing and packaging units at rates 5 to 10 times faster than the
cleaning step, the production capacity is limited by, and is equivalent to, the
capacity of the bottleneck — 10 units per hour.
CEP August 2014 www.aiche.org/cep 59
Reactions and Separations
The maximum sustainable
average throughput should not threaten the
integrity of the equipment, result in a
hazardous release of material or energy,
or violate an environmental permit.
capacity of the production system depends on the capacity
of the bottleneck.
Continuous and batch chemical processing plants can
be modeled as a serial production system. The primary
difference between the capacity analysis of a continuous operation and that of a batch operation is the form of
the mass balance. This article only considers continuous
production systems. (References 2–4 discuss production
capacity for batch processes.)
Defining production capacity
Capacity is often expressed in vague, imprecise, and
inconsistent terms, but fragments of the descriptions provided by the production and operations management literature can be combined to create a comprehensive definition
of capacity.
Production throughput is a dynamic quantity that
fluctuates often. An accurate and meaningful measurement
of throughput depends on the sensitivity of the mass flow
measurement and the period of observation. Therefore,
to obtain a capacity that accurately describes the production system, the calculation should be based on an average
value of throughput.
Reference 5 defines capacity as “the maximum average rate at which entities can flow through the system” and
explicitly acknowledges the need for an average value.
However, this definition does not specify an appropriate
period of observation over which the maximum average
rate of throughput should be maintained.
Reference 6 introduces the term “sustainable” to the
definition of capacity: “[the] maximum sustainable flowrate
if it were fully utilized (without interruptions, downtime,
time wasted to setups, idle periods, and so on).” This, too,
implies that capacity should be based on a time-averaged
interval, and the word “sustainable” suggests that capacity is a throughput that can be maintained for an extended
period of time.
Reference 7 states that “production capacity is the highest sustainable output rate which can be achieved with the
current product specifications, product mix, worker effort,
plant, and equipment.” By introducing the influence of constraints (i.e., product specifications, product mix, etc.), this
definition suggests that the capacity of a production system
is not the instantaneous maximum value of throughput
60 www.aiche.org/cep August 2014 CEP
for a single piece of equipment, but rather the maximum
throughput of the system, sustained for an extended period
of time subject to production constraints.
One factor that sets chemical manufacturing apart from
many other manufacturing sectors is the large quantities of
hazardous materials and energy it uses and produces. All of
the previous definitions of capacity overlook this important
inherent aspect of chemical production. Furthermore, a
design requirement for every chemical plant is that it must
operate in a manner that ensures the health and safety of
the environment and personnel. As a result, a useful definition of capacity must include a clause that dictates that
the maximum sustainable average throughput should not
threaten the integrity of the equipment, result in a hazardous release of material or energy, or violate an environmental permit. These requirements are typically documented as
safe operating limits for the facility.
When we combine the relevant components from each
of these descriptions, we get a clear, useful, and accurate
picture of capacity. This working definition can be stated
as the maximum average throughput that simultaneously
satisfies the following four constraints:
• it takes into account the production restrictions
imposed by the existing equipment, materials, and labor
• it is sustainable for an extended and specified period
of time
• it assures product quality requirements
• it does not exceed the safe operating limits of the
facility.
Deriving production capacity
Three fundamentally different types of production
capacity include design capacity, demonstrated capacity,
and effective capacity. The design capacity is a theoretical
value based on first principles that usually serves as the
design basis for a process plant. In contrast, the demonstrated capacity is an empirically derived value that is
determined from measurements of the plant’s operating
performance. The effective capacity takes into account
plant availability.
Capacity:
The maximum average throughput that satisfies four
constraints:
• it takes into account the production restrictions
imposed by the existing equipment, materials, and labor
• it is sustainable for an extended and specified period
of time
• it assures product quality requirements are met
• it does not exceed the safe operating limits of the
facility.
Copyright © 2014 American Institute of Chemical Engineers (AIChE)
Determine the bottleneck. As discussed previously, to
correctly determine the capacity, the bottleneck of the process must be identified and characterized. The bottleneck
can be quantified theoretically, as the design capacity, or
empirically, as the demonstrated capacity. The implementation of either method depends on the structure and function
of the flowsheet.
The process flowsheet (Figure 2) represents the
sequence of storage and transformation operations that
comprise the process. Storage operations include raw
material storage, intermediate tanks, and product storage. Transformation operations include material handling,
separations, chemical reactors, and heat exchangers.
The flowsheet organizes the storage and transformation operations into a desired process, composed of
three basic flow paths — serial, parallel, and/or recycle.
In a serial flow path, material flows directly from one
operation to the next. A parallel path consists of two or
more serial paths into which the incoming flow is split;
typically, parallel paths are utilized for multiple-train
processes. In a recycle path, one stream is split into two
streams, one of which continues down the serial path
while the other stream is reintroduced at some upstream
point (Figure 3).
When each operation in the flowsheet is designed, it is
sized according to the design basis. This suggests that the
capacity of a chemical process is simply its design basis,
and that capacity is therefore determined before operation begins. However, the actual throughput depends on
physical limitations of the equipment and the commercial
availability of resources from vendors. As material flows
through the processing operations, the actual throughput,
Process
Final Product
Raw Materials
p Figure 2. This type of process flow diagram is typically used in
operations management literature to depict a production system.
Process
Final Product
Raw Materials
Recycle Stream
p Figure 3. This process flow diagram includes a recycle stream that
recirculates some of the product stream back through the system for
further processing.
Copyright © 2014 American Institute of Chemical Engineers (AIChE)
at steady state, is limited by the operation with the lowest
throughput (i.e., the bottleneck). In addition to processing
operations, other potential sources of bottlenecks include
logistical constraints, utility limitations, safe operating
limits, and environmental restrictions.
Determine the design capacity from process calculations. The design capacity is usually dictated by the
design basis for the process flowsheet. The process design
document (e.g., the basis of design) specifies the product
throughput. To verify the stated design capacity, it is necessary to establish the throughput of the bottleneck, which
may be explicitly identified in the design documents. If
the bottleneck is not identified, it can be determined by
inspection of equipment ratings and analysis of the process mass balances.
For simple processes, the bottleneck can be determined by the rated throughput, the operating limit of
a specific piece of equipment, or a limit in an environmental permit. In these instances, the bottleneck can be
established by inspection.
For more complex processes, the mass balances for
each process unit must be checked. If reactor yields
and separation splits are known, this can be reasonably
straightforward; if these values are not available, then more
sophisticated process simulation may be needed.
It is important to document the evaluation process to
communicate to other parties the methodology behind the
design capacity calculation.
Determine the demonstrated capacity by empirical
testing. The motive for determining the demonstrated
capacity is to improve on the design (i.e., theoretical)
capacity calculation by incorporating empirical data.
Usually, a plant’s performance must be measured as a
contractual requirement during plant commissioning to
demonstrate the achievement of a performance guarantee. This assessment is governed by a structured test plan
that prescribes how to operate the plant at steady state, at
specific conditions, for a discrete period of time. The test is
meant to demonstrate the maximum-throughput operation
of the plant while satisfying the four capacity constraints.
In addition to the usual production monitoring process
measurements, supplementary measurements and sampling
may be necessary to validate estimated values of reactor
yields and separation splits. The test plan also includes
data quality objectives (e.g., sensitivity, accuracy, precision) for each process measurement. Depending on the
complexity of the operation, the test plan may also need to
address other operating issues, such as those in Table 1. It
is essential that the appropriate facility managers review
and approve the test plan.
When a formal test plan is not required, demonstrated
capacity may be measured using plant performance data
CEP August 2014 www.aiche.org/cep 61
Reactions and Separations
obtained in the normal course of operation. During this
time, the analyst reviews the historical process data and
identifies data sets that may represent the maximum average throughput from the plant. These instantaneous process
measurements are unlikely to satisfy the governing mass
balances due to confounding effects such as sampling error,
measurement uncertainty, calibration error, signal noise,
and, most significantly, the cumulative residence time of
the material in the process. To mask the effects of the confounding variables, the analyst must choose a reasonable
time-averaging interval that will generate averaged data
suitable for mass balance analysis. A first approximation
for this time-averaging interval is several times the cumulative residence time for the process. If an estimate of the
cumulative residence time is not available, the analyst may
have to select a time interval, select the relevant process
data for the interval, and test it for mass balance closure.
A simple test for mass balance closure compares
the averaged process data with accounting data (8). The
relevant accounting data, which are typically compiled
monthly, consist of inventory measurements of raw materials, work in process, and finished goods. The advantage
of this approach is that it is a comparison of data derived
Table 1. Consider these points when developing
a capacity assessment test plan.
from a set of diverse measurements. A more sophisticated
approach is to use formal process data reconciliation methods (9), which employ a least-squares estimation algorithm
to adjust the process data to obtain the best conformance
with the mass balances.
Determine the effective capacity from plant avail­ability.
To calculate effective capacity, the availability of the plant,
which is defined as the fraction of time that the plant is
up and running, must first be determined. Availability is
calculated as the ratio of uptime to the mission time. The
mission time is the sum of the uptime and downtime
(i.e., zero production); to determine the effective capacity
annually, the mission time is set at one year.
The monthly operating data displayed in Table 2 can
be used to calculate availability and effective capacity. The
availability of the plant is the ratio of the uptime, 342 days,
to the total time of observation, 365 days, so the calculated
availability is 93.7%. The effective capacity is the product of the availability and the design capacity, so if the
design capacity is 200,000 m.t./yr, the effective capacity
is 187,400 m.t./yr.
Downtime is the time interval when the plant is not
running, and can be planned or unplanned. Examples of
planned downtime include turnarounds, vessel cleaning,
and preventative maintenance activities, while unplanned
downtime is caused by equipment failures, utility failures,
or power outages.
Operator Assignments
Will there be operator shift changes during the test?
Beginning of
Downtime
How will shift changeover be handled?
Will staffing for the test require additional personnel?
Operating Procedures
Will the test program use standard operating procedures (SOPs)
or will the SOPs require modification?
If the SOPs will be modified, have the appropriate management
of change (MOC) procedures been implemented and approved?
Has a pre-startup safety review (PSSR) been performed for the
test program?
Process Measurements
Production
Will there be dedicated test program operators or will they have
other duties?
End of
Downtime
Are the routine process measurements satisfactory for the test
program?
Will any additional or nonroutine process measurements be
taken?
How will process measurements be recorded and archived?
Will normal measurement sampling intervals provide the desired
resolution for the test?
62 www.aiche.org/cep August 2014 CEP
Time
p Figure 4. To calculate effective capacity, downtime is modeled as a step
function, with an abrupt drop in production to zero output. Any production
rate above zero, even if it is significantly lower than normal operation, is
considered facility uptime.
Copyright © 2014 American Institute of Chemical Engineers (AIChE)
Table 2. Example plant operating data.
Month
Jan
Feb
Mar
Apr
May
Jun
Jul
Aug
Sept
Oct
Nov
Dec
Total
Mission Time, days
31
28
31
30
31
30
31
31
30
31
30
31
365
Uptime, days
31
26
30
30
31
29
15
31
29
31
30
29
342
Table 3. Example monthly catalytic activity data.
Month
Jan
Feb
Mar
Apr
May
Jun
Jul
Aug
Sept
Oct
Nov
Dec
Catalyst Activity, %
100
98
96
94
92
90
88
86
84
82
80
78
For the purpose of calculating effective capacity,
downtime is modeled as a step function (Figure 4). This is
because downtime does not include reduced or degraded
performance due to factors such as pipe scaling, heat
exchanger fouling, accumulation of trace contaminants, or
catalyst deactivation. Unless these factors force production
to zero, the reduced production is still considered uptime.
The effective capacity can account for declining
production rates in the uptime calculation with a timeaveraging algorithm. Consider a fixed-bed catalytic reactor
that experiences linearly declining catalyst activity. Fresh
catalyst was loaded and the reactor was started in January. Table 3 shows the monthly catalytic activity data for
the observational period (one year). The average catalytic
activity over the 12-mo period is 89%. If the catalytic
Literature Cited
1. Hopp, W. J., and M. L. Spearman, “Factory Physics,” 3rd ed.,
McGraw-Hill, New York, NY (2008).
2. Alford, J. S., et al., “Dynamic Capacity Modeling of Product
Development,” Chem. Eng. Progress, 100 (7), pp. 41–47 (2004).
3. Manganaro, J. L., “Estimate the Capacity of Simple Batch
Processes,” Chem. Eng. Progress, 98 (8), pp. 70–75 (2002).
4. Petrides, D., et al., “Throughput Analysis and Debottlenecking
of Biomanufacturing Facilities,” BioPharm, pp. 2–7 (Aug. 2002).
5. Hopp, W. J., “Supply Chain Science,” McGraw-Hill, New York,
NY (2007).
6. Anupindi, R., et al., “Managing Business Process Flows:
Principles of Operations Management,” 2nd ed., Pearson Prentice
Hall, Upper Saddle River, NJ (2006).
7. Williams, T. J., et al., eds., “A Handbook on Master Planning
and Implementation for Enterprise Integration Programs,”
Institute for Interdisciplinary Engineering Studies, Purdue Univ.,
West Lafayette, IN (2001).
8. Harkins, B., and K. Mills, “Plant Floor vs. Financial Data:
Resolving the Discrepancies,” Chem. Eng. Progress, 97 (9),
pp. 58–64 (2001).
9. Romagnoli, J. A. and M. C. Sanchez, “Data Processing and
Reconciliation for Chemical Process Operations,” Academic
Press, Waltham, MA (2000).
Copyright © 2014 American Institute of Chemical Engineers (AIChE)
reactor is the bottleneck for this process unit, then the
annualized production capacity must be based on the
average catalytic activity of 89%. If the design capacity is
200,000 m.t./yr, the effective capacity is 178,000 m.t./yr.
Closing thoughts
Production capacity is an important factor that needs
to be calculated to determine equipment size, satisfy
contractual requirements, aid supply chain management,
benchmark against competitors, and obtain operating
permits from regulators. There is no single way to measure
capacity, and there are numerous factors to consider, many
of which are unique to a specific process or facility. With
these guidelines, a well-documented methodology, and the
involvement of the appropriate stakeholders, a clear and
unambiguous determination of a chemical plant’s capacity
CEP
can be realized.
Russell A. Ogle, P.E., is a principal engineer with Exponent, Inc.
(Warrenville, IL; Phone: (630) 658-7502; Email: rogle@exponent.
com), where he specializes in the investigation of complex industrial
accidents, catastrophic fires and explosions, and incendiary fires. He
is experienced in process hazard analysis, consequence assessment,
risk assessment, and decision analysis. In addition to his work in
process safety, he regularly consults with clients on process systems
engineering, particularly in the areas of plant performance and process
operations. He has extensive experience evaluating the performance of
chemical process plants, including the analysis of process flowsheets
and production data, the determination of plant capacity, the identification of production bottlenecks, and the investigation of product quality
issues. He is a registered professional engineer in the states of Illinois,
Texas, Louisiana, Arkansas, and Alabama. He received his BS in chemical engineering from Purdue Univ. and his PhD in chemical engineering
from the Univ. of Iowa.
Andrew R. Carpenter, P.E., is a principal engineer with Exponent, Inc.
(Warrenville, IL; Phone: (630) 658-7515; Email: acarpenter@exponent.
com), where he investigates complex chemical process accidents,
analyzes chemical production processes, and assesses process safety
and risk. He has 18 years of experience consulting on investigations of
incidents such as fires, explosions, reactive chemical accidents, and
releases, as well as process safety and risk consulting, including process hazard analysis (PHA), facility risk identification and assessment,
facility siting studies, and layer of protection analysis (LOPA). He is a
registered professional engineer in Illinois and Ohio. He received his BS
in chemical engineering from Iowa State Univ. and his MS in chemical
engineering from the Illinois Institute of Technology.
CEP August 2014 www.aiche.org/cep 63


