VISA INC. NYSE-V
TIMELINESS
SAFETY
TECHNICAL
2
1
2
RECENT
PRICE
High:
Low:
Lowered 2/12/16
27.4 RELATIVE
DIV’D
Median: NMF) P/E RATIO 1.49 YLD 0.8%
73.40 P/ERATIO 25.1(Trailing:
22.5
10.9
22.4
10.4
24.3
16.2
25.9
16.9
38.1
24.6
55.7
38.5
67.3
48.7
81.0
60.0
Target Price Range
2018 2019 2020
LEGENDS
20.0 x ″Cash Flow″ p sh
. . . . Relative Price Strength
4-for-1 split 3/15
Options: Yes
Shaded area indicates recession
Raised 5/16/14
Raised 1/22/16
BETA 1.00 (1.00 = Market)
2018-20 PROJECTIONS
VALUE
LINE
160
120
100
80
60
50
40
30
Ann’l Total
Price
Gain
Return
High 110 (+50%) 11%
Low
90 (+25%)
6%
Insider Decisions
to Buy
Options
to Sell
A
0
0
0
M
0
0
0
J
0
0
0
J
0
0
0
A
0
0
0
S
0
0
0
O N
0 0
0 12
0 0
D
0
2
1
% TOT. RETURN 1/16
Institutional Decisions
1Q2015
2Q2015
3Q2015
623
659
741
to Buy
to Sell
573
567
533
Hld’s(000)179518017953541805196
Percent
shares
traded
75
50
25
1 yr.
3 yr.
5 yr.
THIS
STOCK
VL ARITH.*
INDEX
17.7
92.9
343.1
-10.4
20.6
40.9
20
15
Visa Inc. is the result of the merger of Visa 2005 2006E 2007E 2008 2009 2010 2011 2012 2013 2014 2015 2016 © VALUE LINE PUB. LLC 18-20
USA, Visa International, Visa Canada, and
---2.03
2.28
2.73
3.25
3.84
4.49
5.03
5.65
6.20 Revenues per sh AE
8.75
Inovant. The reorganization was completed
---.63
.80
1.09
1.39
1.67
2.05
2.44
2.82
3.25 ‘‘Cash Flow’’ per sh
4.30
in October 2007. In March of 2008, the com---.56
.73
.98
1.25
1.55
1.90
2.27
2.62
3.00 Earnings per sh ABF
4.00
pany went public, offering 1.62 billion shares
---.03
.11
.13
.15
.22
.80
.33
.42
.50
.60 Div’ds Decl’d per sh G
at an initial price of $11 (figures adjusted for
---.13
.10
.08
.12
.14
.18
.22
.17
.25 Cap’l Spending per sh
.30
3/15 stock split). It raised $17.9 billion in the
---6.86
7.64
8.46
9.35 10.19 10.24 10.86 12.15 13.20 Book Value per sh D
17.30
largest IPO in U.S. history to date. Lead un--- - 3080.0 3036.0 2956.0 2828.0 2712.0 2624.0 2524.0 2457.0 2420.0 Common Shs Outst’g C 2400.0
derwriters were J.P. Morgan and Goldman
---32.6
20.3
20.5
15.7
18.2
21.8
24.6
26.5
Avg Ann’l P/E Ratio
25.0
Sachs, which led a team of other main un---1.96
1.35
1.30
.98
1.16
1.22
1.30
1.35
Relative P/E Ratio
1.55
derwriters and several small banks.
---.1%
.7%
.6%
.8%
.8%
.8%
.8%
.7%
Avg Ann’l Div’d Yield
.8%
CAPITAL STRUCTURE as of 12/31/15
Tot. Debt $15.9 bill.
LT Debt $15.9 bill.
(35% of cap’l)
Leases, Uncapitalized Annual rentals $76 mill.
No Defined Benefits Plan
Pfd Stock None
Common Stock 2184.1 million shares
(includes 1919.1 mill. shs. of class-A common
stock)
MARKET CAP: $160 billion (Large Cap)
CURRENT POSITION 2014
2015 12/31/15
($MILL.)
Cash Assets
1971
3518 12837
Receivables
822
847
922
Other
6769
5656 11714
Current Assets
9562 10021 25473
Accts Payable
147
127
118
Debt Due
---Other
5859
5228
5239
Current Liab.
6006
5355
5357
--------------
2948
30.3%
140
455
34.8%
15.4%
201
41
583
NMF
NMF
NMF
--
3590
37.3%
137
739
36.0%
20.6%
d775
-d501
-----
6263
46.9%
237
1700
23.8%
27.1%
4009
-21141
8.0%
8.0%
7.6%
5%
6911
54.5%
226
2213
42.7%
32.0%
4799
44
23189
9.5%
9.5%
8.2%
14%
8065
60.2%
265
2966
36.1%
36.8%
5236
32
25011
11.8%
11.9%
10.4%
12%
9188
62.5%
288
3650
35.5%
39.7%
5739
-26437
13.8%
13.8%
12.2%
12%
10421
63.1%
333
4203
33.4%
40.3%
3832
-27630
15.2%
15.2%
13.1%
14%
11778
64.8%
397
4980
31.4%
42.3%
3487
-26870
18.5%
18.5%
15.3%
17%
12702
64.0%
435
5438
29.6%
42.8%
3556
-27413
19.8%
19.8%
16.2%
18%
13880
68.9%
494
6328
29.6%
39.8%
4666
-29842
21.2%
21.2%
15.7%
19%
15000
65.0%
550
7250
33.0%
48.3%
6250
10000
32000
17.5%
22.5%
18.0%
19%
Revenues ($mill) AEF
Operating Margin
Depreciation ($mill)
Net Profit ($mill) AB
Income Tax Rate
Net Profit Margin
Working Cap’l ($mill)
Long-Term Debt ($mill)
Shr. Equity ($mill)
Return on Total Cap’l
Return on Shr. Equity
Retained to Com Eq
All Div’ds to Net Prof
21000
65.0%
700
9600
33.0%
45.7%
7500
Nil
41500
23.0%
23.0%
18.0%
20%
BUSINESS: Visa Inc. is the world’s largest retail electronic payments network providing processing services and payment product
platforms. This includes credit, debit, prepaid, and commercial payments, which are offered under the Visa, Visa Electron, Interlink,
and PLUS brands. Visa/PLUS is one of the largest global ATM
networks, offering cash access in local currency in more than 200
countries. Visa’s global network, VisaNet, delivers value-added processing, including fraud and risk management. Has about 8,500
employees. Off. and dir. own less than 1.0% of common stock
(12/15 proxy). Chairman: Joseph W. Saunders. CEO: Charles W.
Scharf. Inc.: DE. Address: P.O. Box 8999, San Francisco, CA
94128. Telephone: 415-932-2100. Internet: www.visa.com.
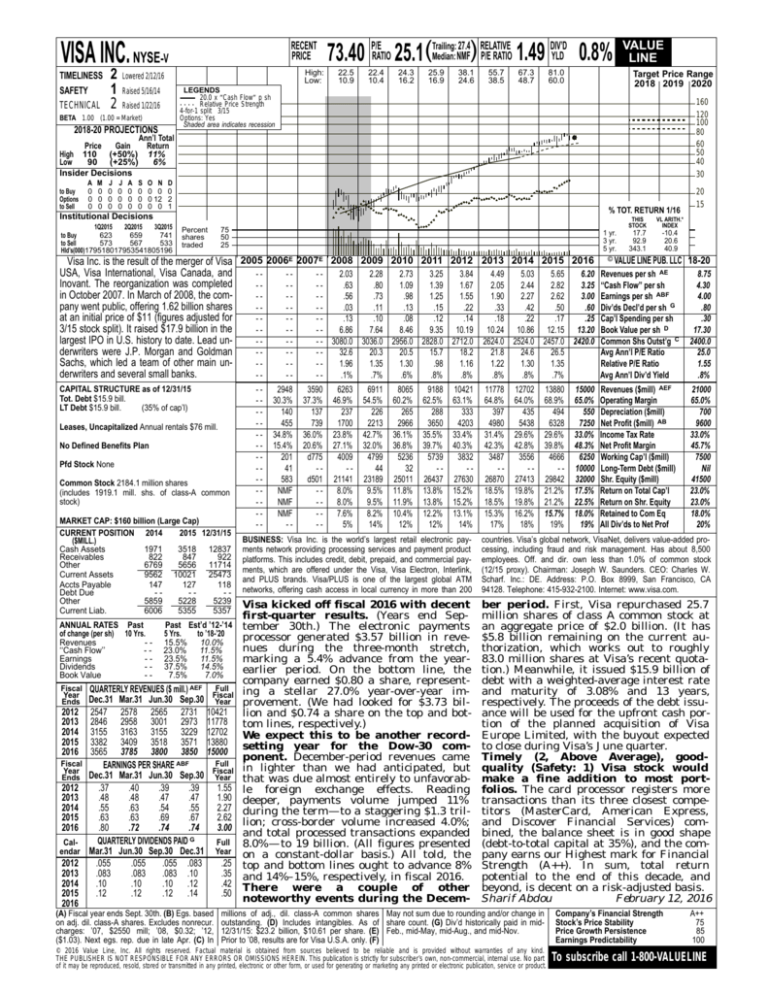
Visa kicked off fiscal 2016 with decent
first-quarter results. (Years end SepANNUAL RATES Past
Past Est’d ’12-’14 tember 30th.) The electronic payments
of change (per sh) 10 Yrs.
5 Yrs.
to ’18-’20
processor generated $3.57 billion in reveRevenues
- - 15.5% 10.0%
nues during the three-month stretch,
‘‘Cash Flow’’
- - 23.0% 11.5%
Earnings
- - 23.5% 11.5%
marking a 5.4% advance from the yearDividends
- - 37.5% 14.5%
earlier period. On the bottom line, the
Book Value
-7.5%
7.0%
company earned $0.80 a share, representFiscal QUARTERLY REVENUES ($ mill.) AEF
Full
Year
Fiscal ing a stellar 27.0% year-over-year imEnds Dec.31 Mar.31 Jun.30 Sep.30 Year provement. (We had looked for $3.73 bil2012 2547 2578 2565 2731 10421 lion and $0.74 a share on the top and bot2013 2846 2958 3001 2973 11778 tom lines, respectively.)
2014 3155 3163 3155 3229 12702 We expect this to be another record2015 3382 3409 3518 3571 13880 setting year for the Dow-30 com2016 3565 3785 3800 3850 15000
ponent. December-period revenues came
Fiscal
Full
EARNINGS PER SHARE ABF
Year
Fiscal in lighter than we had anticipated, but
Ends Dec.31 Mar.31 Jun.30 Sep.30 Year that was due almost entirely to unfavorab2012
.37
.40
.39
.39
1.55 le foreign exchange effects. Reading
2013
.48
.48
.47
.47
1.90 deeper, payments volume jumped 11%
2014
.55
.63
.54
.55
2.27 during the term—to a staggering $1.3 tril2015
.63
.63
.69
.67
2.62 lion; cross-border volume increased 4.0%;
2016
.80
.72
.74
.74
3.00
and total processed transactions expanded
QUARTERLY DIVIDENDS PAID G
CalFull 8.0%—to 19 billion. (All figures presented
endar Mar.31 Jun.30 Sep.30 Dec.31 Year on a constant-dollar basis.) All told, the
2012
.055
.055
.055 .083
.25 top and bottom lines ought to advance 8%
2013
.083
.083
.083 .10
.35 and 14%–15%, respectively, in fiscal 2016.
2014
.10
.10
.10 .12
.42 There were a couple of
other
2015
.12
.12
.12 .14
.50
noteworthy events during the Decem2016
ber period. First, Visa repurchased 25.7
million shares of class A common stock at
an aggregate price of $2.0 billion. (It has
$5.8 billion remaining on the current authorization, which works out to roughly
83.0 million shares at Visa’s recent quotation.) Meanwhile, it issued $15.9 billion of
debt with a weighted-average interest rate
and maturity of 3.08% and 13 years,
respectively. The proceeds of the debt issuance will be used for the upfront cash portion of the planned acquisition of Visa
Europe Limited, with the buyout expected
to close during Visa’s June quarter.
Timely (2, Above Average), goodquality (Safety: 1) Visa stock would
make a fine addition to most portfolios. The card processor registers more
transactions than its three closest competitors (MasterCard, American Express,
and Discover Financial Services) combined, the balance sheet is in good shape
(debt-to-total capital at 35%), and the company earns our Highest mark for Financial
Strength (A++). In sum, total return
potential to the end of this decade, and
beyond, is decent on a risk-adjusted basis.
Sharif Abdou
February 12, 2016
(A) Fiscal year ends Sept. 30th. (B) Egs. based
on adj. dil. class-A shares. Excludes nonrecur.
charges: ’07, $2550 mill; ’08, $0.32; ’12,
($1.03). Next egs. rep. due in late Apr. (C) In
millions of adj., dil. class-A common shares May not sum due to rounding and/or change in
outstanding. (D) Includes intangibles. As of share count. (G) Div’d historically paid in mid12/31/15: $23.2 billion, $10.61 per share. (E) Feb., mid-May, mid-Aug., and mid-Nov.
Prior to ’08, results are for Visa U.S.A. only. (F)
© 2016 Value Line, Inc. All rights reserved. Factual material is obtained from sources believed to be reliable and is provided without warranties of any kind.
THE PUBLISHER IS NOT RESPONSIBLE FOR ANY ERRORS OR OMISSIONS HEREIN. This publication is strictly for subscriber’s own, non-commercial, internal use. No part
of it may be reproduced, resold, stored or transmitted in any printed, electronic or other form, or used for generating or marketing any printed or electronic publication, service or product.
Company’s Financial Strength
Stock’s Price Stability
Price Growth Persistence
Earnings Predictability
A++
75
85
100
To subscribe call 1-800-VALUELINE

