Sample questions: EXAM 2
advertisement
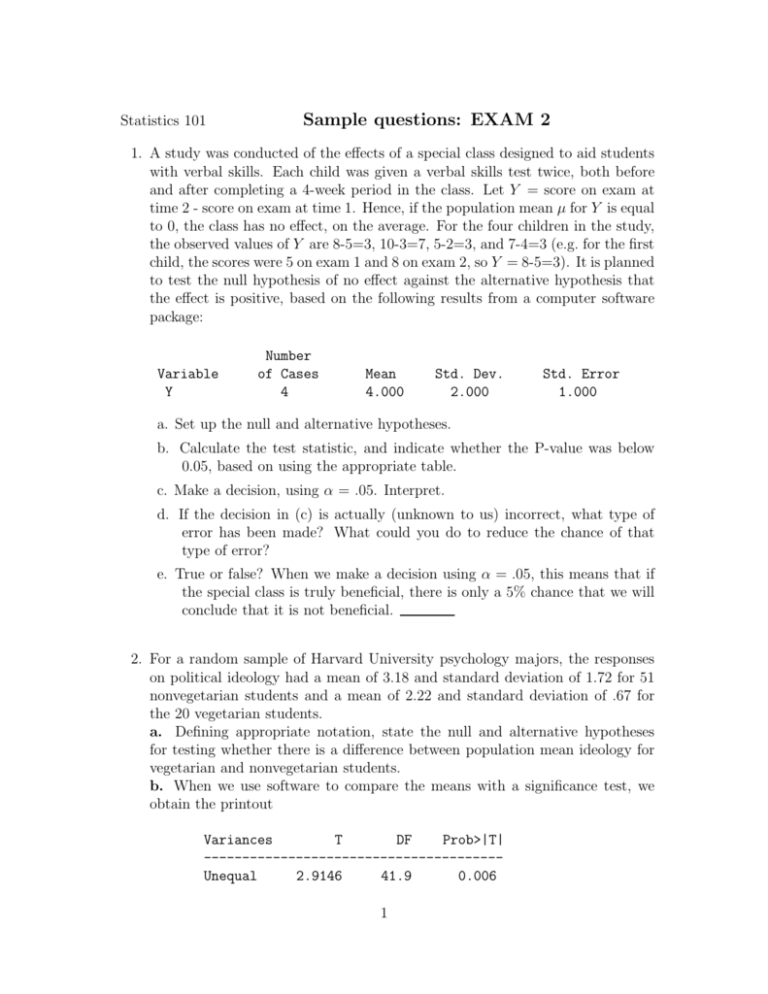
Statistics 101 Sample questions: EXAM 2 1. A study was conducted of the effects of a special class designed to aid students with verbal skills. Each child was given a verbal skills test twice, both before and after completing a 4-week period in the class. Let Y = score on exam at time 2 - score on exam at time 1. Hence, if the population mean µ for Y is equal to 0, the class has no effect, on the average. For the four children in the study, the observed values of Y are 8-5=3, 10-3=7, 5-2=3, and 7-4=3 (e.g. for the first child, the scores were 5 on exam 1 and 8 on exam 2, so Y = 8-5=3). It is planned to test the null hypothesis of no effect against the alternative hypothesis that the effect is positive, based on the following results from a computer software package: Variable Y Number of Cases 4 Mean 4.000 Std. Dev. 2.000 Std. Error 1.000 a. Set up the null and alternative hypotheses. b. Calculate the test statistic, and indicate whether the P-value was below 0.05, based on using the appropriate table. c. Make a decision, using α = .05. Interpret. d. If the decision in (c) is actually (unknown to us) incorrect, what type of error has been made? What could you do to reduce the chance of that type of error? e. True or false? When we make a decision using α = .05, this means that if the special class is truly beneficial, there is only a 5% chance that we will conclude that it is not beneficial. 2. For a random sample of Harvard University psychology majors, the responses on political ideology had a mean of 3.18 and standard deviation of 1.72 for 51 nonvegetarian students and a mean of 2.22 and standard deviation of .67 for the 20 vegetarian students. a. Defining appropriate notation, state the null and alternative hypotheses for testing whether there is a difference between population mean ideology for vegetarian and nonvegetarian students. b. When we use software to compare the means with a significance test, we obtain the printout Variances T DF Prob>|T| --------------------------------------Unequal 2.9146 41.9 0.006 1 Interpret the P -value, in context, based on its definition. (Note: You are not being asked to make a decision at some α-level.) 3. A multiple-choice test question has four possible responses. The question is designed to be very difficult, with none of the four responses being obviously wrong, yet with only one correct answer. It first occurs on an exam taken by 400 students. The designers test whether more people answer the question correctly than would be expected just due to chance (i.e., if everyone randomly guessed the correct answer). a. Set up the hypotheses for the test. b. Of the 400 students, 125 correctly answer the question. Find the P -value, and interpret. c. Make a decision about H0 , using α = .05. Based on this decision, what can you conclude about the parameter? 4. (13 pts.) A geographer conducts a study of the relationship between the level of economic development of a nation (measured in thousands of dollars for per capita GDP) and the birth rate (average number of children per adult woman). For one analysis of the data, a part of the computer printout reports Statistic Value SE -------------------------------------Correlation -0.460 0.170 a. Explain how to interpret the reported value of the correlation. b. Can you tell whether the sign of the slope in the corresponding prediction equation would be positive or negative? Why? c. Suppose the prediction equation were ŷ = 5.6 − 0.1x. Interpret the slope, and show how to find the predicted birth rate for a nation that has x = 40. d. Sketch a scatterplot for which it would be inappropriate to use the correlation to describe the association. 5. A study on educational aspirations of high school students (S. Crysdale, International Journal of Comparative Sociology, Vol. 16, 1975, pp. 19–36) measured aspirations using the scale (some high school, high school graduate, some college, college graduate). For students whose family income was low, the counts in these categories were (9, 44, 13, 10); when family income was middle, the counts were (11, 52, 23, 22); when family income was high, the counts were (9, 41, 12, 27). Software provides the results shown below. a. Find the sample conditional distribution on aspirations for those whose family income was high. 2 Table 1: Statistic DF Value Prob -----------------------------------------------Chi-Square 6 8.871 0.181 b. Give all steps of the chi-squared test, explaining how to interpret the P value. c. Explain what further analyses you could do that would be more informative than a chi-squared test. The following questions are true or false. Indicate T or F next to each. 6. For a given set of data on two quantitative variables X and Y , the slope of the least squares prediction equation and the correlation must have the same sign. 7. For a given set of data on two quantitative variables X and Y , the prediction equation and the correlation do not depend on the units of measurement. 8. The standardized residual that follows up the chi-squared test for a contingency table has value 3.2 in the cell in row 1 and column 1. This means that if the variables were independent, it would be very unusual to observe so many observations in that cell. 9. Suppose that a study reports that a 95% confidence interval for the difference µ1 − µ2 between the population mean annual incomes for whites (µ1 ) and for Hispanics (µ2 ) having jobs in home construction is ($5000, $5400). Then, a 95% confidence interval for the difference µ2 −µ1 between the population mean annual incomes for Hispanics and for whites having jobs in home construction is (-$5400, -$5000). 10. A study of medical utilization compares mean stay in the hospital for heart transplant operations in 2009 to the mean stay in 1995, for two separate samples of such operations in the two years. In the comparison, since the same variable (“length of stay in the hospital”) is measured for each sample, the 3 data should be analyzed using methods for dependent samples (such as the paired-difference t test) rather than independent samples. 11. Refer to the previous question. Suppose the data in 1995 were summarized by ȳ1 = 10.5, s1 = 8.9 (n1 = 54), and the data in 2009 were summarized by ȳ2 = 8.0, s1 = 7.8 (n2 = 48). These statistics suggest that the variable “length of stay in the hospital” does not have a normal distribution. Therefore, even though the samples are relatively large, we cannot use the formula (ȳ1 − ȳ2 ) ± t(se), which assumes normal population distributions. 12. For large samples, the reason we refer the z test statistic for testing a proportion or difference of proportions to the normal distribution is because these methods assume that the population distribution is normal. 13. Most statisticians believe that social scientists and other users of statistics put too much emphasis on confidence intervals and not enough on significance tests, since significance tests give us more information about the value of a parameter than confidence intervals. 14. When we make a decision in a significance test, the reason we say “Do not reject H0 ” instead of “Accept H0 ” is because a confidence interval for the parameter would show that the number in H0 is one of only many plausible values for the parameter. 15. We decide to conduct a significance test to see if there is enough evidence to predict whether a majority or a minority of Floridians are in favor of affirmative action. Letting π denote the population proportion of Floridians in favor of affirmative action, we would set up the hypotheses as H0 : π 6= .50 and Ha : π = .50. 16. In the 1982 General Social Survey, 350 subjects reported the time spent every day watching television. The sample mean was 4.1 hours, with standard deviation 3.2. In a more recent General Social Survey, 1965 subjects reported a mean time spent watching television of 2.8 hours, with standard deviation 2.0. The standard error used in inference (confidence intervals and significance tests) about the true difference in population means in these two years equals 3.2 + 2.0 = 5.2. 17. Refer to the previous question. Based on the means and standard deviations reported here, it seems very plausible that the true population distribution of time spent watching television was very close to the normal distribution in both of these years. 4 18. Refer to the previous two questions. If, in fact, the population distributions are not normal in these years, then it is invalid to construct t confidence intervals and tests about the difference of means. Select the correct response(s) in the following problems. 19. To compare the population mean annual incomes for Hispanics (µ1 ) and for whites (µ2 ) having jobs in construction, we construct a 95% confidence interval for µ2 − µ1 . a. If the confidence interval is (3000, 6000), then at this confidence level we conclude that the mean income for whites is lower than for Hispanics. b. If the confidence interval is (–1000, 3000), then the corresponding test of H0 : µ1 = µ2 against Ha : µ1 = 6 µ2 has a P-value above .05. c. If the confidence interval is (–1000, 3000), then we can conclude that µ1 = µ2 . d. If the confidence interval is (–1000, 3000), then we can conclude that 95% of the white subjects in the population have income between $1000 less and $3000 more than 95% of the Hispanic subjects in the population. 20. In using a t test for a mean, we assume that a. The population distribution is normal, although in practice the method is robust to this assumption for two-sided tests. b. The sample is selected randomly. c. y is a dependent variable, and µ0 is an independent variable. d. Each expected frequency is at least about 5. e. None of the above, because the t test is robust against violations of all its assumptions. 5 Solutions to Practice Exercises 1. a. H0 : µ = 0, Ha : µ > 0, b. t = 4.0 with df = 3, P -value is ¡ 0.05, since t table tells us that t = 2.353 has P -value = 0.05 for one-sided test with df = 3. c. Reject H0 and conclude that µ > 0 (effect is positive). d. Type I error, reduce α cut-off point to the desired P (Type I error). e. False 2. a. Let µ1 and µ2 be population means on political ideology for nonvegetarians and for vegetarians for the population of all Harvard psychology majors. H0 : µ1 = µ2 , Ha : µ1 6= µ2 . b. If the population means were actually equal, the probability would equal only 0.006 of getting a test statistic this large or even larger in absolute value (i.e., even more extreme relative to H0 ). 3. Let π = population proportion of correct responses. a. H0 : π = 0.25, Ha > q 0.25. b. se0 = 0.25(0.75)/400 = 0.02156, z = (0.3125 − 0.25)/0.02165 = 2.89. P -value = 0.002. Very strong evidence against null and in favor of the alternative the more people in the population answer it correctly than due to chance. If H0 were true, probability would equal only 0.002 of getting a z test statistic of 2.89 or even larger. c. Reject H0 . Conclude that π > 0.25. 4. a. Moderate negative association between GDP and birth rate. Birth rate ends to decrease as GDP increases. b. negative, because slope and correlation have same sign. c. The birth rate is predicted to decrease by 0.1 fo r every increase of one thousand dollars in per capita GDP. ŷ = 1.6. d. A U-shaped or other highly non-linear relationship. The correlation describes strength of linear association. 5. a. (10%, 46%, 13%, 30%). b. H0 : variables are statistically independent, Ha : variables are statistically dependent, test statistic is χ2 = 8.87 with df = 6, giving right-tail probability = 0.18. If H0 were true, would not be unusual to get data like observed. It is plausible that educational aspirations and family income are independent (but note, we would not want to accept H0 ). c. Follow up with a residual analysis, and with measures of association such as comparing proportions in a particular aspirations category for those with high family income to those with low family income. 6. T, 7. F, 8. T, 9. T, 10. F, 11. F, 12. F, 13. F, 14. T, 15. F, 16. F, 17. F, 18. F 19. a. F, b. T, c. F, d. F 20. a. T, b. T, c. F, d. F, e. F. 6

