General Biology
advertisement
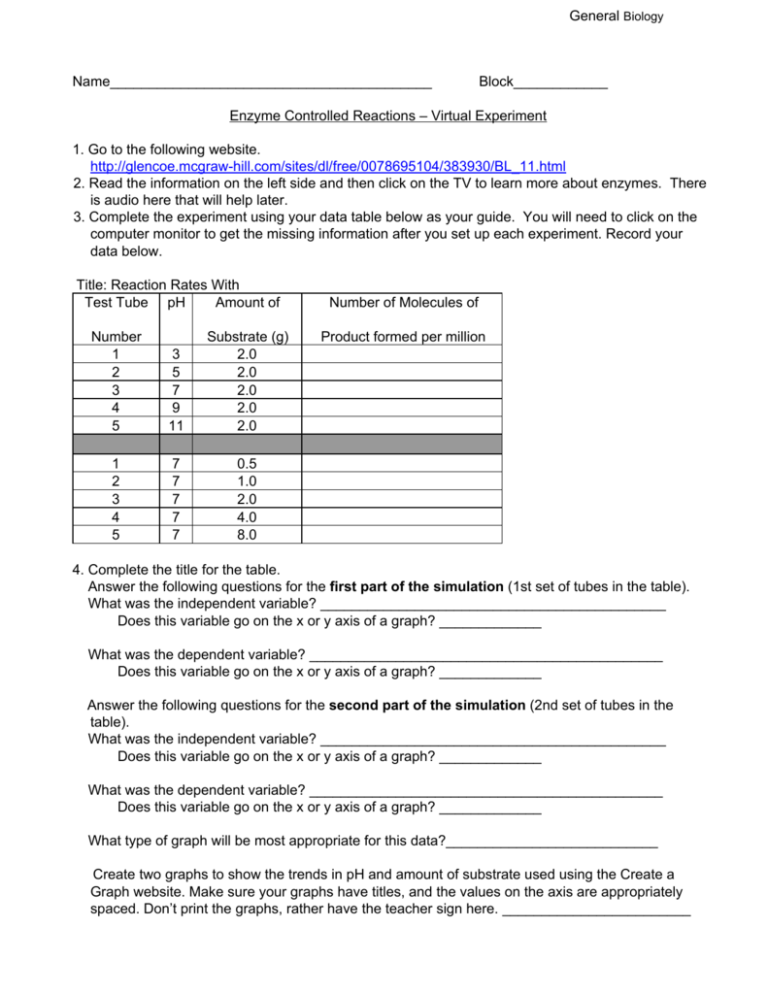
General Biology Name_________________________________________ Block____________ Enzyme Controlled Reactions – Virtual Experiment 1. Go to the following website. http://glencoe.mcgraw­hill.com/sites/dl/free/0078695104/383930/BL_11.html 2. Read the information on the left side and then click on the TV to learn more about enzymes. There is audio here that will help later. 3. Complete the experiment using your data table below as your guide. You will need to click on the computer monitor to get the missing information after you set up each experiment. Record your data below. Title: Reaction Rates With Test Tube pH Amount of Number of Molecules of Number Substrate (g) Product formed per million 1 3 2.0 2 5 2.0 3 7 2.0 4 9 2.0 5 11 2.0 1 7 0.5 2 7 1.0 3 7 2.0 4 7 4.0 5 7 8.0 4. Complete the title for the table. Answer the following questions for the first part of the simulation (1st set of tubes in the table). What was the independent variable? ____________________________________________ Does this variable go on the x or y axis of a graph? _____________ What was the dependent variable? _____________________________________________ Does this variable go on the x or y axis of a graph? _____________ Answer the following questions for the second part of the simulation (2nd set of tubes in the table). What was the independent variable? ____________________________________________ Does this variable go on the x or y axis of a graph? _____________ What was the dependent variable? _____________________________________________ Does this variable go on the x or y axis of a graph? _____________ What type of graph will be most appropriate for this data?___________________________ Create two graphs to show the trends in pH and amount of substrate used using the Create a Graph website. Make sure your graphs have titles, and the values on the axis are appropriately spaced. Don’t print the graphs, rather have the teacher sign here. ________________________ General Biology Conclusion: 1. Review. What is the function of enzymes? 2. Review. What conditions may cause an enzyme to not function properly? 3. Refer to graph 1. Describe the relationship between pH and number of molecules of product formed. Support your claims with quantitative data. 4. Refer to graph 2. Describe the relationship between substrate concentration and number of product formed. Support your claims with quantitative data. 5. What is the optimal pH level for this enzyme to work best? ________ Which graph show this information? ________ 6. Enzymes function most efficiently at the temperature of a typical cell, which is 37 degrees Celsius. Increases or decreases in temperature can significantly lower the reaction rate. What does this suggest about the importance of temperature­regulating mechanisms in organisms? Explain. College Readiness Standards­Science I 13.2 Identify basic features of a table, graph, or diagram (e.g. headings, units of measurement, axis labels). I 16.2 Understand basic scientific terminology. I 16.4 Determine how the value of one variable changes as the value of another variable changes in a simple data presentation. I 20.2 Compare or combine data from a simple data presentation. I 20.3 Translate information into a table, graph, or diagram. E 20.1 Select a simple hypothesis, prediction, or conclusion that is supported by a data presentation or model.


