PHY1 Core Assesment Lab F = ma Objectives: (1) To determine the
advertisement
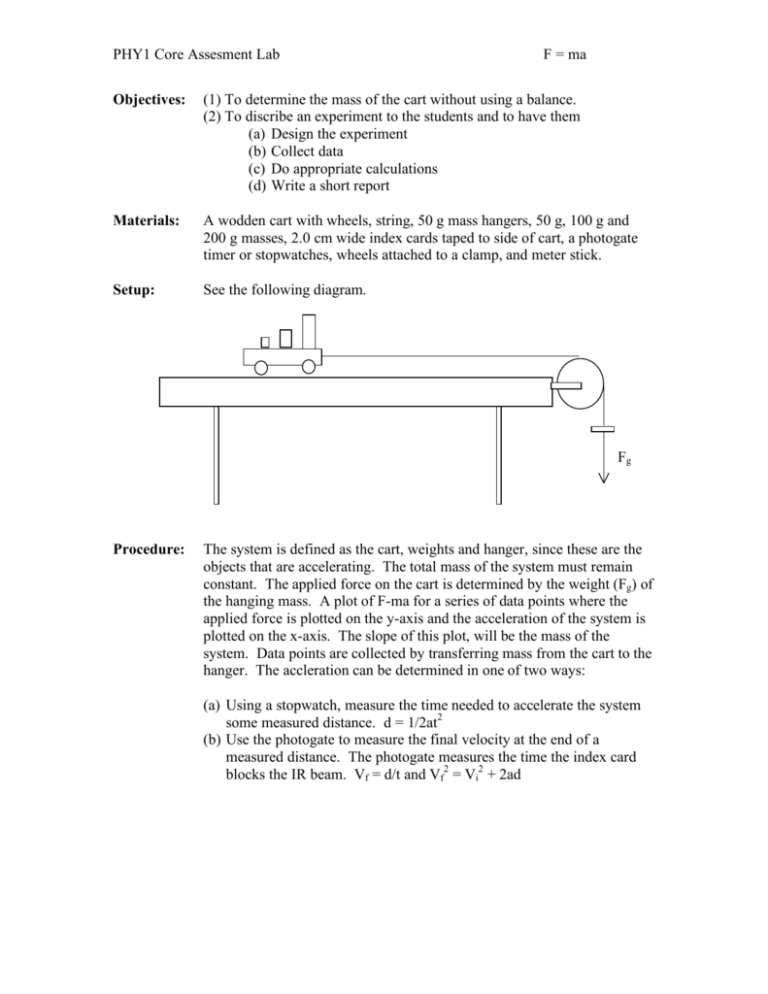
PHY1 Core Assesment Lab F = ma Objectives: (1) To determine the mass of the cart without using a balance. (2) To discribe an experiment to the students and to have them (a) Design the experiment (b) Collect data (c) Do appropriate calculations (d) Write a short report Materials: A wodden cart with wheels, string, 50 g mass hangers, 50 g, 100 g and 200 g masses, 2.0 cm wide index cards taped to side of cart, a photogate timer or stopwatches, wheels attached to a clamp, and meter stick. Setup: See the following diagram. Fg Procedure: The system is defined as the cart, weights and hanger, since these are the objects that are accelerating. The total mass of the system must remain constant. The applied force on the cart is determined by the weight (Fg) of the hanging mass. A plot of F-ma for a series of data points where the applied force is plotted on the y-axis and the acceleration of the system is plotted on the x-axis. The slope of this plot, will be the mass of the system. Data points are collected by transferring mass from the cart to the hanger. The accleration can be determined in one of two ways: (a) Using a stopwatch, measure the time needed to accelerate the system some measured distance. d = 1/2at2 (b) Use the photogate to measure the final velocity at the end of a measured distance. The photogate measures the time the index card blocks the IR beam. Vf = d/t and Vf2 = Vi2 + 2ad PHY1 Core Assesment Lab F = ma Report Format: The report will not exceed a total of two pages, using single spaced 12 point “times” font. The following section headings must be included. Name: Title: Purpose: Materials: Procedure: Data and Calculations: Conclusions: Grading Rubric Item Title and Purpose Criteria • • • Report • Presentation • • • Equipment • • • Data • • Calculations • • Graph • • • Conclusions • • Brief appropriate descriptive title Clear statement of purpose 3rd person passive Spelling and grammer Clear and concise Sections headings List of equipment Correct names Diagram of set up An organized table of measured data including descriptive headings and units Sample calculations Correct mathematics Correct use of equations and variables Graph with axes labels and units Appropriate variables on the x and y axes Best fit line and slope calculations Brief explanation of experiment approach Statement of result Identifcation of sources of error Expert (3 pts) Skilled (2 pts) Novice (1 pts) Deficient (0 pts) PHY1 Core Assesment Lab F = ma
