World Population Growth
advertisement
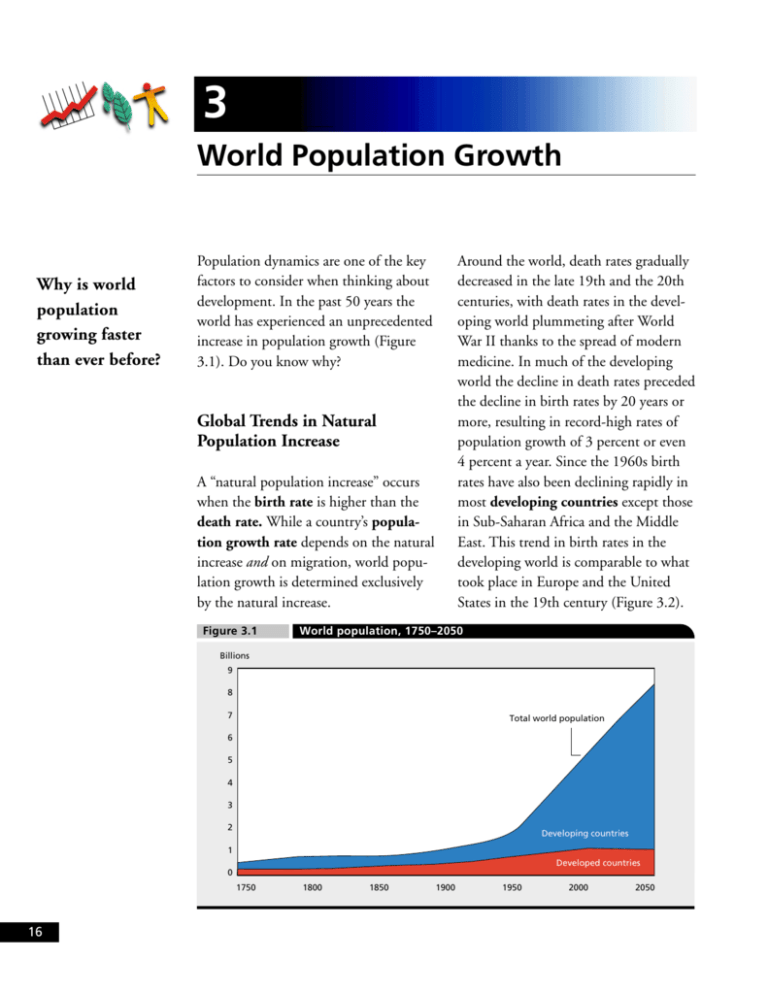
3 World Population Growth Why is world population growing faster than ever before? Around the world, death rates gradually decreased in the late 19th and the 20th centuries, with death rates in the developing world plummeting after World War II thanks to the spread of modern medicine. In much of the developing world the decline in death rates preceded the decline in birth rates by 20 years or more, resulting in record-high rates of population growth of 3 percent or even 4 percent a year. Since the 1960s birth rates have also been declining rapidly in most developing countries except those in Sub-Saharan Africa and the Middle East. This trend in birth rates in the developing world is comparable to what took place in Europe and the United States in the 19th century (Figure 3.2). Population dynamics are one of the key factors to consider when thinking about development. In the past 50 years the world has experienced an unprecedented increase in population growth (Figure 3.1). Do you know why? Global Trends in Natural Population Increase A “natural population increase” occurs when the birth rate is higher than the death rate. While a country’s population growth rate depends on the natural increase and on migration, world population growth is determined exclusively by the natural increase. Figure 3.1 World population, 1750–2050 Billions 9 8 Agriculture 7 Total world population 6 Services 5 4 3 2 Industry Developing countries 1 Developed countries 0 1750 16 1800 1850 1900 1950 2000 2050 3 WORLD POPULATION GROWTH Figure 3.2 Trends in birth and death rates, 1850–2000 Births/deaths per 1,000 people 50 Death rate in developing countries Birth rate in developing countries 40 30 20 Natural population increase Natural population increase Death rate in developed countries Birth rate in developed countries 10 0 1850 1875 1900 1925 1950 1975 2000 Note: Developed countries include high-income countries and present-day transition economies. Today’s low-income countries still have the world’s highest birth rates (see Map 3.1), although women tend to have fewer children than before. The reasons for lower fertility are varied, but most are related to developing countries’ economic growth and human development (Figure 3.3; see also Chapters 4 and 7). Parents choose to have smaller families when health conditions improve so that they no longer have to fear that many of their babies might die, and when they do not have to rely on their children to work on the family farm or business or to take care of them in their old age. In addition, more parents are sending their daughters to school, which is important also because women with basic education tend to produce healthier children and smaller families. More women now have opportunities to work outside the home, so they are starting their families later and having fewer children. On top of all that, access to family planning is improving, so parents can control the number and spacing of their children. A lower fertility rate may not immediately lead to a lower birth rate and lower population growth if a country has a larger number of men and women in their reproductive years than before. Population growth caused by more women giving birth even though each has the same number of or fewer children is called “demographic momentum.” Demographic momentum is particularly significant in developing countries that had the highest fertility rates 20–30 years ago. The decline in birth rates over the past few decades has lowered population 17 BEYOND ECONOMIC GROWTH Map 3.1 More than 3% Population growth rates, 1985–95 2.5–3% 2–2.4% 1–1.9% Less than 1% growth rates in developing countries despite a continuing decline in death rates. Population growth is even slower in developed countries (Figure 3.4). Stabilizing birth rates and increasing death rates (the latter being a result of aging populations; see Chapter 8) have already led to a natural population decrease in Italy and Germany. Japan and Spain are expected to follow soon (see birth rates and death rates in Data Table 1). Over the past 30 years the worldwide population growth rate fell from more than 2.0 percent to 1.5 percent a year, and experts expect this trend to continue. 18 No data But in absolute numbers the world’s population is growing faster than ever before—by about 230,000 people a day in mid-1995. This is happening because of the larger than ever population base. In 1995 there were about 5.7 billion people on earth, almost twice as many as in 1970. The next 35 years are projected to add another 2.5 billion people—90 percent of them in developing countries. The share of developing countries in the world population is expected to increase from 84 percent to 88 percent. In the short run, rapid population growth in poor countries leads to lower 3 WORLD POPULATION GROWTH Figure 3.3 Average fertility rates, 1980 and 1995 Births per woman 8 7 6.7 6.1 6 5.7 5.3 5 4.2 4.1 4 4.1 3.5 3.1 3.1 2.8 3 1.9 2 2.2 2.5 2.0 1.7 1 Why are fertility and population growth rates different in different countries? 0 Low- and middleincome countries Highincome countries 1980 Middle East and North Africa South Asia Latin America and the Caribbean East Asia and the Pacific Europe and Central Asia 1995 Figure 3.4 2.0 SubSaharan Africa Average annual population growth rates, 1980–2010 1.9% 1.8 1.7% 1.6 1.5% 1.4 1.2% 1.2 1.0 0.8 0.7% 0.6 0.4% 0.4 0.2 0.0 –0.2 Low-income countries 1980–95 Middle-income countries High-income countries 1995–2010 19 BEYOND ECONOMIC GROWTH Why are demographic changes in transition countries of Europe different from those occurring in most developing countries? Demographic Changes in Transition Countries of Europe and 1980s. In the 1990s death rates actually increased in Russia and some other transition countries, including Belarus, Bulgaria, Estonia, Latvia, Lithuania, Moldova, Romania, and Ukraine. In 1995 the death rate in Russia equaled the average for SubSaharan Africa—15 deaths per 1,000 people—while the average death rate for developing countries was 9 per 1,000 and for developed countries was 8 per 1,000. The formerly socialist countries of Central and Eastern Europe present a major exception to the broad similarity of demographic trends in developed and developing countries. The rapid decline in death rates that occurred in the 1950s and 1960s slowed down in the 1970s This dramatic and historically unprecedented reversal in mortality trends is primarily explained by higher adult male mortality: among older men mainly because of the increase in cardiovascular disease, among younger men because of more accidents, suicides, and murders. GNP per capita, allowing fewer resources to be invested in each person’s human capital—the key to increasing labor productivity. But in the long run, provided that labor productivity does in fact increase, having more workers could contribute to the economic strength of developing countries. Figure 3.5 Demographic changes in three countries with transition economies, 1979–95 Per 1,000 people 93 19 95 91 19 89 19 87 19 85 19 83 19 81 79 19 19 95 93 19 91 19 19 19 19 19 19 19 19 19 19 19 19 19 19 19 19 19 Death rate 89 0 87 0 85 0 83 5 81 5 79 5 95 10 93 10 91 10 89 15 87 15 85 15 83 20 81 20 79 20 Birth rate 20 Czech Republic Latvia 19 Russia 3 WORLD POPULATION GROWTH Many of these factors can be related to substance abuse—heavy drinking and smoking, which in turn can be linked to worsening living conditions and the greater uncertainty and stress that have accompanied the transition. But rapid economic reforms have not necessarily been detrimental to people’s health in all transition countries. For example, in the Czech Republic the death rate has continued to decline (Figure 3.5), while in Hungary and Poland it has held steady. Birth rates in the transition countries of Europe have dropped sharply in the past 5–10 years. The reasons for that drop are different from those in most developing countries: they are believed to be closely associated with a lower quality of life caused by the social and economic crisis of transition. As a result fertility rates in these countries are now far below the “replacement level” (equaling slightly more than two children per family) and lower than those in most developed countries (see Figure 3.3). Because of these unusual demographic trends—increasing death rates combined with dropping birth rates—many of the transition countries of Europe (for example, Russia and Latvia, see Figure 3.5) have experienced natural decreases in population. 21


