Interpretation and Definition of the Linear Regression Equation
advertisement

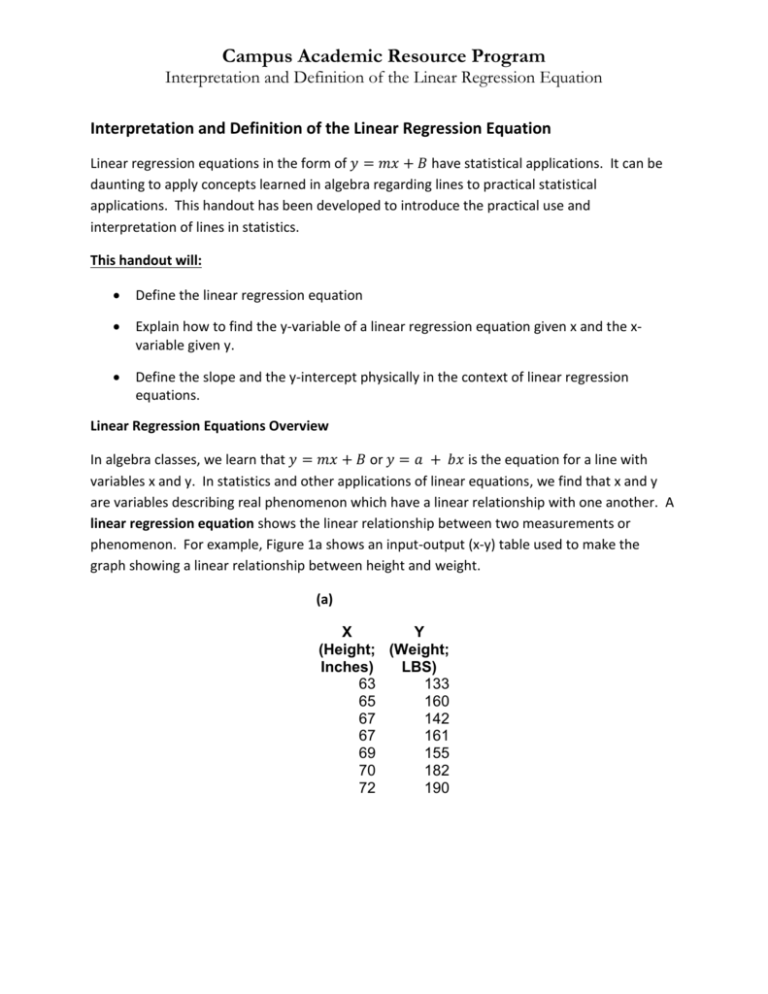
Campus Academic Resource Program Interpretation and Definition of the Linear Regression Equation Interpretation and Definition of the Linear Regression Equation Linear regression equations in the form of 𝑦 = 𝑚𝑥 + 𝐵 have statistical applications. It can be daunting to apply concepts learned in algebra regarding lines to practical statistical applications. This handout has been developed to introduce the practical use and interpretation of lines in statistics. This handout will: Define the linear regression equation Explain how to find the y-variable of a linear regression equation given x and the xvariable given y. Define the slope and the y-intercept physically in the context of linear regression equations. Linear Regression Equations Overview In algebra classes, we learn that 𝑦 = 𝑚𝑥 + 𝐵 or 𝑦 = 𝑎 + 𝑏𝑥 is the equation for a line with variables x and y. In statistics and other applications of linear equations, we find that x and y are variables describing real phenomenon which have a linear relationship with one another. A linear regression equation shows the linear relationship between two measurements or phenomenon. For example, Figure 1a shows an input-output (x-y) table used to make the graph showing a linear relationship between height and weight. (a) X Y (Height; (Weight; Inches) LBS) 63 133 65 160 67 142 67 161 69 155 70 182 72 190 Campus Academic Resource Program Interpretation and Definition of the Linear Regression Equation (b) Weight (LBS) 200 190 180 170 160 150 140 130 120 62 64 66 68 Height (Inches) 70 72 74 Figure 1. (a) Input-output tables can be used to create x-y plots such as that in (b). This plot shows a linear relationship between height and hand length. The linear regression equation for the relationship between height and hand length is 𝑦 = 5.6051𝑥 − 218.32 𝑜𝑟 (𝑤𝑒𝑖𝑔ℎ𝑡) = 5.605 ∗ (ℎ𝑒𝑖𝑔ℎ𝑡) − 218.3. From this equation, we can predict how much a person weighs, given their height. This can be done by algebraically solving for the x or y variable as shown in example 1. Example 1: After asking the heights and weights of 7 men, there was a linear relationship found between a man’s height and his weight. The following equation describes this relationship: y = 5.6051x 218.32; where y is the weight of a man and x is the height of a man. (a) Predict the weight of a man who is 64 inches (5’4”) tall. (b) If a man has a weight of 150 lbs, estimate his height. Campus Academic Resource Program Interpretation and Definition of the Linear Regression Equation Answers: a. Plug 64 in for x: 𝑦 = 5.6051𝑥 − 218.32 𝑦 = 5.6051(64) − 218.32 𝑦 = 140.7 𝑙𝑏𝑠 Thus a 64 inch tall man is predicted to be 140.7 lbs b. Plug in 150 for y: 𝑦 = 5.6051𝑥 − 218.38 150 = 5.6051𝑥 − 218.32 Solve for x: 𝑥= (150 + 218.32) 5.6051 𝑥 = 65.7 𝑖𝑛𝑐ℎ𝑒𝑠 Thus a man who is 150 lbs is expected to be 65.7 inches (5’5 and ¾ “) Analysis of the Y-Intercept In algebra, you may remember that the y-intercept, B in 𝑦 = 𝑚𝑥 + 𝐵 or “a” in 𝑦 = 𝑎 + 𝑏𝑥, is where a line crosses the y-axis. In applied statistics, the y – intercept can provide useful insight into your data set. The following questions should provide a bit of insight into how to analyze the y-intercept from a linear regression equation. Exercise 1: y-intercept Interpretation Exploration 1. Using the equation, y = 5.6051x - 218.32 where y is the weight and x the height of a man, if a man was theoretically 0 inches tall (which is impossible but we will suspend our disbelief for this problem), how much would he weigh? Campus Academic Resource Program Interpretation and Definition of the Linear Regression Equation 2. How does the height of a 0 inch tall person compare to the y-intercept of the linear regression equation given above? Based on this, summarize what the y-intercept of the linear regression equation means in this problem. 3. Generally, describe what the y-intercept in a linear regression equation means. How’d the above exercise go? Did you arrive at the conclusion that the y-intercept describes what weight a man would be if he is 0 inches tall? If you did, great! If not, understand that the y-intercept, or B term of a linear regression equation, is the predicted value of the y phenomenon if the x phenomenon is 0. Sometimes the y-intercept explains a realistic prediction and sometimes the y-intercept in a linear regression equation describes something that physically does not make sense (ie: a person being 0 inches tall and having a weight of -218 lbs does not make sense). Analysis of the Slope You may remember the slope (“𝑚” 𝑜𝑓 𝑦 = 𝑚𝑥 + 𝐵 𝑜𝑟 “𝑏” 𝑜𝑓 𝑦 = 𝑎 + 𝑏𝑥) of a line as rise 𝑟𝑖𝑠𝑒 over run, 𝑟𝑢𝑛 , from algebra. This is usually a more theoretical math concept; however, when working with linear regression equations, the slope has a very physical meaning. The following questions should provide a bit of insight into how to analyze the slope from a linear regression equation. Campus Academic Resource Program Interpretation and Definition of the Linear Regression Equation Exercise 2: Slope Interpretation Exploration 1. When graphing a line, what is the slope (HINT: it involves rise and run or change in x and change in y). 2. Given the following slopes from linear equations, what numerical value is the rise (change in y) and what numerical value is the run (change in x)? a. 3 4 b. 5.605 3. Let’s say the slope from question 2b comes from the same study that found a linear relationship between a man’s weight and his height. Remember, the linear regression equation found was: 𝑤𝑒𝑖𝑔ℎ𝑡 = 5.6051(ℎ𝑒𝑖𝑔ℎ𝑡) − 218.32 (a) What is the projected weight of a man who is 73 inches tall (6’1”)? (b) What is the projected weight of a man who is 74 inches tall (6’2”)? 4. What is the change of weight of a man who is 73 inches tall to a man who is 74 inches tall (i.e.: How much more does a man who is 74 inches tall weigh than a man who is 73 inches tall?) How does this value compare to the slope? 5. Based on your answer to question 4, what is the meaning of slope in this problem? (i.e. For every _______ inch taller a man is, his weight increases by _______ lbs). Were you able to interpret the slope by the end of that problem set? Did you find a slope of 5.6 in the linear regression equation correlates to a man’s weight increasing by 5.6 lbs for every inch taller he is? If yes, then great! If not then understand that the slope is how many units y changes per change of 1 unit in x. Campus Academic Resource Program Interpretation and Definition of the Linear Regression Equation Conclusion This handout explored how to use linear regression equations to solve for the independent and dependent variables, and interpret the slope and y intercept of lines that describe real phenomenon. For additional practice, please refer to the Interpretation and Definition of the Linear Regression Equation Practice Handout. Campus Academic Resource Program Interpretation and Definition of the Linear Regression Equation Citations Introduction to Linear Regression. (n.d.). Retrieved May 15, 2015, from http://onlinestatbook.com/2/regression/intro.html


