1005: Lines and Linear Models
advertisement
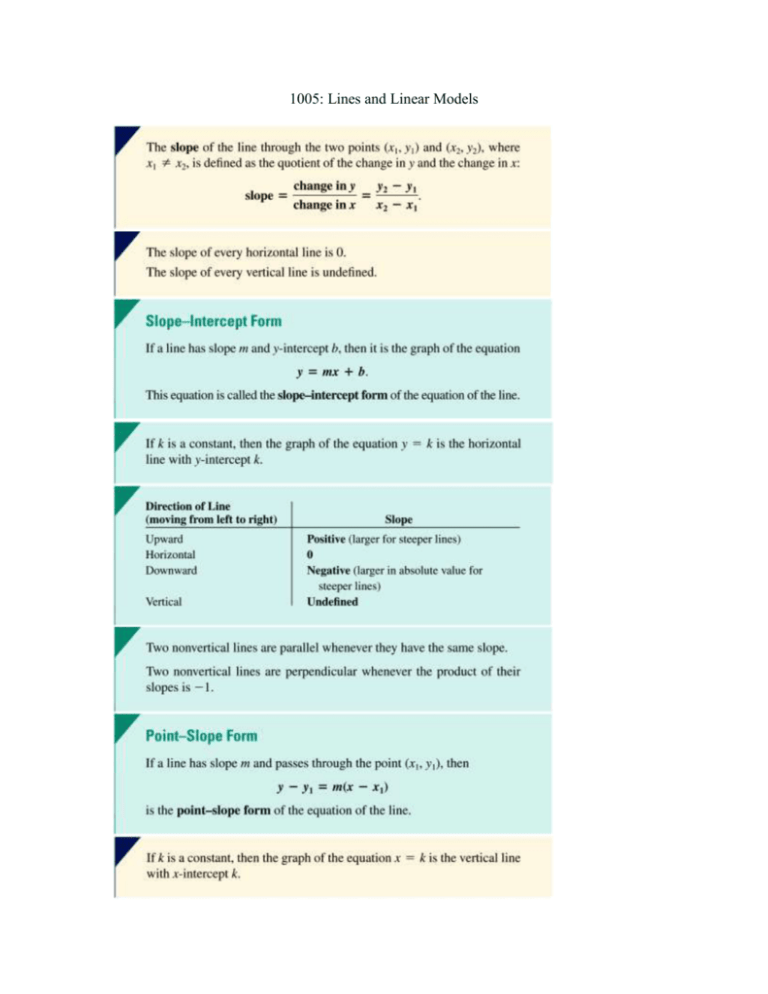
1005: Lines and Linear Models -----------------------------------------------------------------------------------------------------------In business and science, it is often necessary to make judgments on the basis of data from the past. For instance, a stock analyst might use a company's profits in previous years to estimate the next year's profits. Or a life insurance company might look at life expectancies of people born in various years to predict how much money it should expect to pay out in the next year. In such situations, the available data is used to construct a mathematical model, such as an equation or a graph, which is used to approximate the likely outcome in cases where complete data is not available. In this section, we consider applications in which the data can be modeled by a linear equation. The simplest way to construct a linear model is to use the line determined by two of the data points, as illustrated in the following example. Example 1: Business The profits of the General Electric Company (GE), in billions of dollars, over a five-year period are shown in the following table: (a) Let x = 3 correspond to 2003, and plot the points (x, y), where x is the year and y is the profit. (b) Use the data points (3, 15) and (7, 22.2) to find a line that models the data. (c) Use the data points (4, 16.6) and (6, 20.8) to find another line that models the data. (d) Use the model in part (b) to estimate the profits in 2006. The line of best fit is called the least-squares regression line, and the computational process for finding its equation is called linear regression. We will use a graphing calculator to do linear regressions quickly and easily for us. Example 2: Business Using the table from Example 1 and a graphing calculator: (a) Plot the data points, with x = 3 corresponding to 2003. (b) Find the least-squares regression line for this data. (c) Graph the data points and the regression line on the same screen. -----------------------------------------------------------------------------------------------------------1005 Assignment (1) Find the slope of the line through the points (-6, 8) and (5, 4). (2) Find the slope of the horizontal line y = 3 (3) What is the slope of the vertical line x = 2 (4) Find an equation for the line with y-intercept 7/2 and slope -5/2 (5) Find the equation of the horizontal line with y-intercept 3 (6) Find the slope and y-intercept for each of the following lines. (a) 5x - 3y = 1 (b) -9x + 6y = 2 (7) Sketch the graph of x + 2y = 5 and label the intercepts. (8) Determine whether each of the given pairs of lines are parallel, perpendicular, or neither. (a) 2x + 3y = 5 and 4x + 5 = -6y (b) 3x = y + 7 and x + 3y = 4 (c) x + y = 4 and x - 2y = 3 (9) Find the equation of the line with: (a) slope 2; the point (5, 3) (b) slope -3; the point (-4, 1) (10) Find an equation of the line through (5, 4) and (-10, 2) (11) Education According to data from the National center for Education Statistics, the average cost of tuition and fees in public four-year colleges was $2987 in the fall of 1996 and grew in an approximately linear fashion to $5685 in the fall of 2006. (a) Find a linear equation for this data. (b) Assuming the equation remains valid beyond fall 2006, estimate the average cost of tuition and fees in the fall of 2014.


