Economic Freedom Score Country Comparisons Freedom Trend 52.5
advertisement
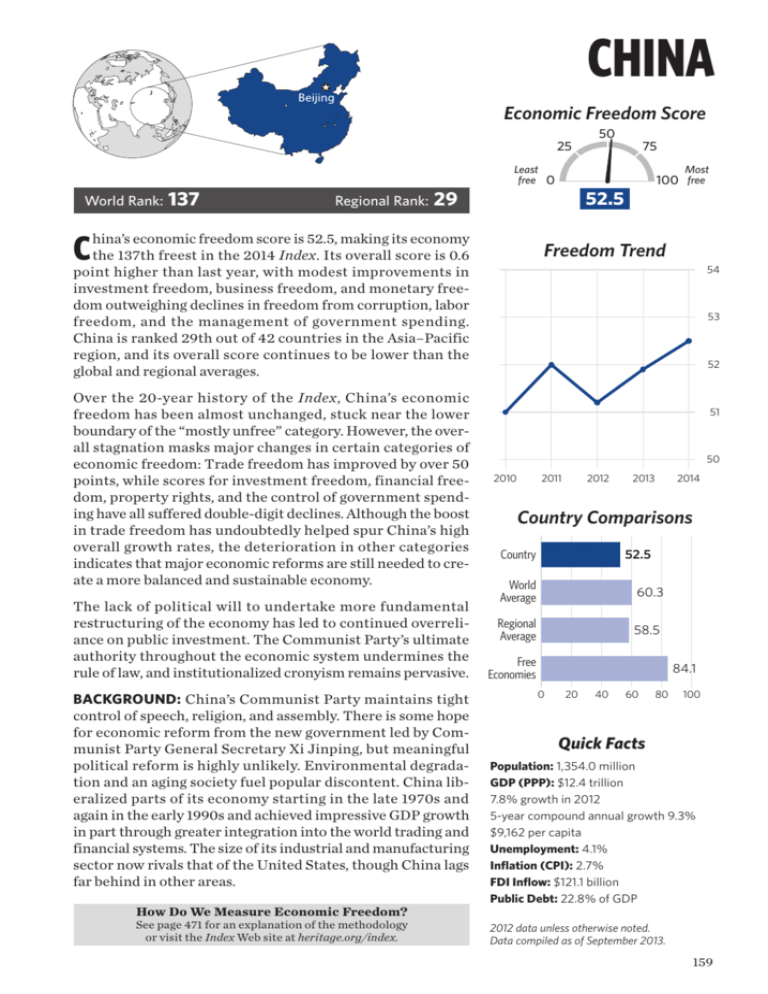
CHINA Economic Freedom Score 25 World Rank: 137 Regional Rank: 29 Least free 0 economic freedom score is 52.5, making its economy Cpointhina’s the 137th freest in the 2014 Index. Its overall score is 0.6 higher than last year, with modest improvements in 50 75 Most 100 free 52.5 Freedom Trend 54 investment freedom, business freedom, and monetary freedom outweighing declines in freedom from corruption, labor freedom, and the management of government spending. China is ranked 29th out of 42 countries in the Asia–Pacific region, and its overall score continues to be lower than the global and regional averages. Over the 20-year history of the Index, China’s economic freedom has been almost unchanged, stuck near the lower boundary of the “mostly unfree” category. However, the overall stagnation masks major changes in certain categories of economic freedom: Trade freedom has improved by over 50 points, while scores for investment freedom, financial freedom, property rights, and the control of government spending have all suffered double-digit declines. Although the boost in trade freedom has undoubtedly helped spur China’s high overall growth rates, the deterioration in other categories indicates that major economic reforms are still needed to create a more balanced and sustainable economy. The lack of political will to undertake more fundamental restructuring of the economy has led to continued overreliance on public investment. The Communist Party’s ultimate authority throughout the economic system undermines the rule of law, and institutionalized cronyism remains pervasive. BACKGROUND: China’s Communist Party maintains tight control of speech, religion, and assembly. There is some hope for economic reform from the new government led by Communist Party General Secretary Xi Jinping, but meaningful political reform is highly unlikely. Environmental degradation and an aging society fuel popular discontent. China liberalized parts of its economy starting in the late 1970s and again in the early 1990s and achieved impressive GDP growth in part through greater integration into the world trading and financial systems. The size of its industrial and manufacturing sector now rivals that of the United States, though China lags far behind in other areas. How Do We Measure Economic Freedom? See page 471 for an explanation of the methodology or visit the Index Web site at heritage.org/index. 53 52 51 50 2010 2011 2012 2013 2014 Country Comparisons 52.5 Country World Average 60.3 Regional Average 58.5 Free Economies 84.1 0 20 40 60 80 100 Quick Facts Population: 1,354.0 million GDP (PPP): $12.4 trillion 7.8% growth in 2012 5-year compound annual growth 9.3% $9,162 per capita Unemployment: 4.1% Inflation (CPI): 2.7% FDI Inflow: $121.1 billion Public Debt: 22.8% of GDP 2012 data unless otherwise noted. Data compiled as of September 2013. 159 CHINA (continued) THE TEN ECONOMIC FREEDOMS Score RULE OF LAW Country World Average Property Rights 20.0 Freedom from Corruption 35.0 0 20 40 60 80 Rank 1–Year Change 139th 77th 0 –1.0 100 Many anti-corruption whistleblowers face physical violence or intimidation from those they expose and enjoy little protection from the police or the internal disciplinary investigators of the ruling Chinese Communist Party. Various forms of corruption severely affect banking, finance, government procurement, and construction. China’s weak judicial system is highly vulnerable to political influence and corruption. All land is state-owned. Fiscal Freedom 69.9 GOVERNMENT Government Spending 82.9 SIZE 136th 42nd 0 20 40 60 80 –0.3 –0.4 100 The top individual income tax rate is 45 percent, and the top corporate tax rate is 25 percent. Other taxes include a value-added tax (VAT) and a real estate tax. The overall tax burden is 19 percent of GDP. Total government expenditures account for 24 percent of GDP, and reported public debt is 23 percent of gross domestic output. The new government has responded to a slowing economy with temporary small-business tax cuts and stimulus spending. REGULATORY EFFICIENCY Business Freedom 49.7 Labor Freedom 61.9 Monetary Freedom 73.3 153rd 91st 120th 0 20 40 60 80 +1.7 –0.7 +1.7 100 It takes 13 procedures and over a month to launch a business. Completing licensing requirements remains time-consuming and costs over three times the level of average annual income. Relatively rigid labor regulations still hinder overall employment growth. The state provides massive fuel and electricity subsidies; agricultural subsidies (estimated at $160 billion) are twice those of the U.S. and the EU combined. OPEN MARKETS Trade Freedom 71.8 Investment Freedom 30.0 Financial Freedom 30.0 121st 152nd 132nd 0 20 40 60 80 –0.2 +5.0 0 100 China’s average tariff rate is 4.1 percent. The prevalence of state-owned enterprises and government subsidies continues to distort the economy. The state continues its tight control of the financial system as its primary means for managing the rest of the economy. The government owns all large financial institutions, which lend according to state priorities and directives and favor large state enterprises. Long-Term Score Change (since 1995) RULE OF LAW Property Rights Freedom from Corruption 160 –10.0 +5.0 GOVERNMENT SIZE Fiscal Freedom Government Spending –0.7 –10.8 REGULATORY EFFICIENCY Business Freedom Labor Freedom Monetary Freedom 2014 Index of Economic Freedom OPEN MARKETS –5.3 –3.1 +5.0 Trade Freedom +51.8 Investment Freedom –20.0 Financial Freedom –20.0
