Download PDF
advertisement
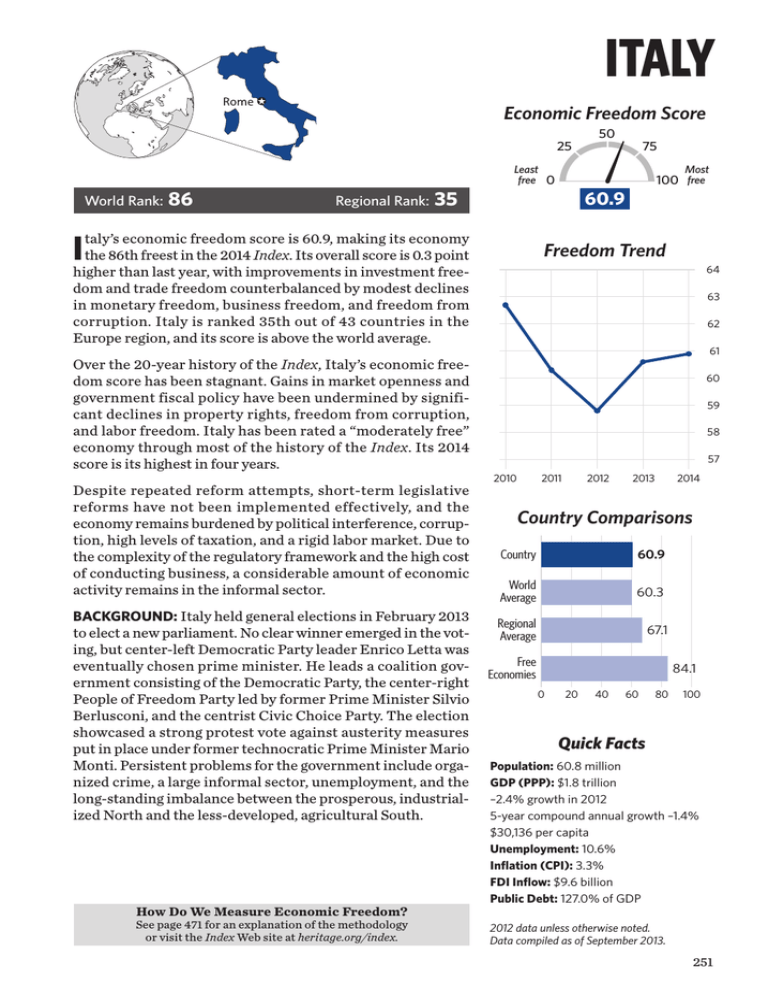
ITALY Economic Freedom Score 25 World Rank: 86 Regional Rank: 35 Least free 0 taly’s economic freedom score is 60.9, making its economy Ihigher the 86th freest in the 2014 Index. Its overall score is 0.3 point than last year, with improvements in investment free- 50 75 Most 100 free 60.9 Freedom Trend 64 dom and trade freedom counterbalanced by modest declines in monetary freedom, business freedom, and freedom from corruption. Italy is ranked 35th out of 43 countries in the Europe region, and its score is above the world average. Over the 20-year history of the Index, Italy’s economic freedom score has been stagnant. Gains in market openness and government fiscal policy have been undermined by significant declines in property rights, freedom from corruption, and labor freedom. Italy has been rated a “moderately free” economy through most of the history of the Index. Its 2014 score is its highest in four years. Despite repeated reform attempts, short-term legislative reforms have not been implemented effectively, and the economy remains burdened by political interference, corruption, high levels of taxation, and a rigid labor market. Due to the complexity of the regulatory framework and the high cost of conducting business, a considerable amount of economic activity remains in the informal sector. BACKGROUND: Italy held general elections in February 2013 to elect a new parliament. No clear winner emerged in the voting, but center-left Democratic Party leader Enrico Letta was eventually chosen prime minister. He leads a coalition government consisting of the Democratic Party, the center-right People of Freedom Party led by former Prime Minister Silvio Berlusconi, and the centrist Civic Choice Party. The election showcased a strong protest vote against austerity measures put in place under former technocratic Prime Minister Mario Monti. Persistent problems for the government include organized crime, a large informal sector, unemployment, and the long-standing imbalance between the prosperous, industrialized North and the less-developed, agricultural South. How Do We Measure Economic Freedom? See page 471 for an explanation of the methodology or visit the Index Web site at heritage.org/index. 63 62 61 60 59 58 57 2010 2011 2012 2013 2014 Country Comparisons Country 60.9 World Average 60.3 Regional Average 67.1 Free Economies 84.1 0 20 40 60 80 100 Quick Facts Population: 60.8 million GDP (PPP): $1.8 trillion –2.4% growth in 2012 5-year compound annual growth –1.4% $30,136 per capita Unemployment: 10.6% Inflation (CPI): 3.3% FDI Inflow: $9.6 billion Public Debt: 127.0% of GDP 2012 data unless otherwise noted. Data compiled as of September 2013. 251 ITALY (continued) THE TEN ECONOMIC FREEDOMS Score RULE OF LAW Country World Average Property Rights 50.0 Freedom from Corruption 38.5 0 20 40 60 80 Rank 1–Year Change 53rd 70th 0 –0.5 100 Corruption and a culture of lawlessness and tax evasion remain central issues. In 2012, a court sentenced former Prime Minister Silvio Berlusconi to prison for tax fraud. He is appealing the sentence. The legal system is vulnerable to political interference. Property rights and contracts are secure, but court procedures are extremely slow. Many companies choose to settle out of court. Protection of intellectual property is below EU norms. Fiscal Freedom 55.5 GOVERNMENT Government Spending 25.6 SIZE 173rd 166th 0 20 40 60 80 0 +0.3 100 The top individual income tax rate is 43 percent, and the top corporate tax rate is 27.5 percent. Other taxes include a value-added tax (VAT) and an inheritance tax. The overall tax burden is 43 percent of GDP. Public expenditures amount to about 50 percent of the domestic economy. Italy has struggled to meet budget goals to rein in its burdensome public debt, which has grown to 127 percent of GDP. REGULATORY EFFICIENCY Business Freedom 75.5 Labor Freedom 52.5 Monetary Freedom 78.9 47th 128th 48th 0 20 40 60 80 –1.4 +0.5 –1.3 100 Completing licensing requirements takes over 200 days and costs more than the level of average annual income. Serious labor market rigidities constrain job growth, and the informal labor market accounts for a large proportion of employment. Monetary stability has been relatively well maintained, and the government has reduced subsidies for renewable energy sources. OPEN MARKETS Trade Freedom 87.8 Investment Freedom 85.0 Financial Freedom 60.0 11th 13th 41st 0 20 40 60 80 +1.0 +5.0 0 100 EU members have a low 1.1 percent average tariff rate and, in general, few non-tariff barriers to trade. Investment in some sectors of Italy’s economy may be screened by the government. The financial sector provides a relatively wide range of services but remains subject to political interference. The banking sector has been strained by the European sovereign debt crisis. Long-Term Score Change (since 1995) RULE OF LAW Property Rights Freedom from Corruption 252 –20.0 –31.5 GOVERNMENT SIZE Fiscal Freedom Government Spending +11.9 +22.0 REGULATORY EFFICIENCY OPEN MARKETS Business Freedom –9.5 Labor Freedom –22.0 Monetary Freedom –2.2 Trade Freedom +10.0 Investment Freedom +15.0 Financial Freedom +10.0 2014 Index of Economic Freedom
