Defining malnutrition in India: how much is too little, how much
advertisement

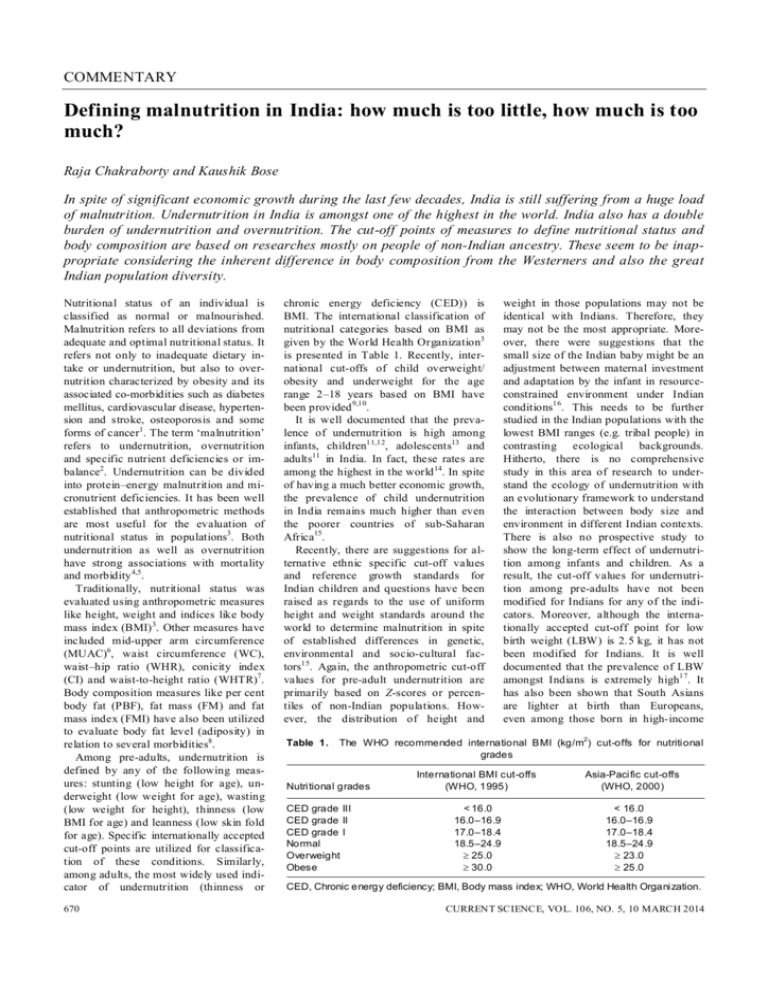
COMMENTARY Defining malnutrition in India: how much is too little, how much is too much? Raja Chakraborty and Kaushik Bose In spite of significant economic growth during the last few decades, India is still suffering from a huge load of malnutrition. Undernutrition in India is amongst one of the highest in the world. India also has a double burden of undernutrition and overnutrition. The cut-off points of measures to define nutritional status and body composition are based on researches mostly on people of non-Indian ancestry. These seem to be inappropriate considering the inherent difference in body composition from the Westerners and also the great Indian population diversity. Nutritional status of an individual is classified as normal or malnourished. Malnutrition refers to all deviations from adequate and optimal nutritional status. It refers not only to inadequate dietary intake or undernutrition, but also to overnutrition characterized by obesity and its associated co-morbidities such as diabetes mellitus, cardiovascular disease, hypertension and stroke, osteoporosis and some forms of cancer1. The term ‘malnutrition’ refers to undernutrition, overnutrition and specific nutrient deficiencies or imbalance2. Undernutrition can be divided into protein–energy malnutrition and micronutrient deficiencies. It has been well established that anthropometric methods are most useful for the evaluation of nutritional status in populations3. Both undernutrition as well as overnutrition have strong associations with mortality and morbidity 4,5. Traditionally, nutritional status was evaluated using anthropometric measures like height, weight and indices like body mass index (BMI) 3. Other measures have included mid-upper arm circumference (MUAC)6, waist circumference (WC), waist–hip ratio (WHR), conicity index (CI) and waist-to-height ratio (WHTR)7. Body composition measures like per cent body fat (PBF), fat mass (FM) and fat mass index (FMI) have also been utilized to evaluate body fat level (adiposity) in relation to several morbidities8. Among pre-adults, undernutrition is defined by any of the following measures: stunting (low height for age), underweight (low weight for age), wasting (low weight for height), thinness (low BMI for age) and leanness (low skin fold for age). Specific internationally accepted cut-off points are utilized for classification of these conditions. Similarly, among adults, the most widely used indicator of undernutrition (thinness or 670 chronic energy deficiency (CED)) is BMI. The international classification of nutritional categories based on BMI as given by the World Health Organization3 is presented in Table 1. Recently, international cut-offs of child overweight/ obesity and underweight for the age range 2–18 years based on BMI have been provided 9,10. It is well documented that the prevalence of undernutrition is high among infants, children11,12, adolescents13 and adults11 in India. In fact, these rates are among the highest in the world 14. In spite of having a much better economic growth, the prevalence of child undernutrition in India remains much higher than even the poorer countries of sub-Saharan Africa15. Recently, there are suggestions for alternative ethnic specific cut-off values and reference growth standards for Indian children and questions have been raised as regards to the use of uniform height and weight standards around the world to determine malnutrition in spite of established differences in genetic, environmental and socio-cultural factors15. Again, the anthropometric cut-off values for pre-adult undernutrition are primarily based on Z-scores or percentiles of non-Indian populations. However, the distribution of height and Table 1. weight in those populations may not be identical with Indians. Therefore, they may not be the most appropriate. Moreover, there were suggestions that the small size of the Indian baby might be an adjustment between maternal investment and adaptation by the infant in resourceconstrained environment under Indian conditions16. This needs to be further studied in the Indian populations with the lowest BMI ranges (e.g. tribal people) in contrasting ecological backgrounds. Hitherto, there is no comprehensive study in this area of research to understand the ecology of undernutrition with an evolutionary framework to understand the interaction between body size and environment in different Indian contexts. There is also no prospective study to show the long-term effect of undernutrition among infants and children. As a result, the cut-off values for undernutrition among pre-adults have not been modified for Indians for any of the indicators. Moreover, although the internationally accepted cut-off point for low birth weight (LBW) is 2.5 kg, it has not been modified for Indians. It is well documented that the prevalence of LBW amongst Indians is extremely high17. It has also been shown that South Asians are lighter at birth than Europeans, even among those born in high-income The WHO recommended international BMI (kg/m2) cut-offs for nutritional grades Nutritional grades CED grade III CED grade II CED grade I Normal Overweight Obese International BMI cut-offs (WHO, 1995) Asia-Pacific cut-offs (WHO, 2000) < 16.0 16.0–16.9 17.0–18.4 18.5–24.9 25.0 30.0 < 16.0 16.0–16.9 17.0–18.4 18.5–24.9 23.0 25.0 CED, Chronic energy deficiency; BMI, Body mass index; WHO, World Health Organization. CURRENT SCIENCE, VOL. 106, NO. 5, 10 MARCH 2014 COMMENTARY countries such as the UK18, and Indian neonates were substantially lighter at birth than the UK neonates, although they had similar adiposity19 and lesser fat free mass20. These findings should raise questions about the validity of applying the international cut-off point for Indian neonates. The BMI is generally considered as a good indicator of not only the nutritional status but also the socio-economic condition of a population, especially adult populations of developing countries21. A low BMI of < 18.5 kg/m2 in developing countries has traditionally been attributed to CED, i.e. a ‘steady’ underweight in which an individual is in energy balance irrespective of a loss in body weight or body energy stores. Such a ‘steady’ underweight is likely to be associated with morbidity or other physiological and functional impairments22. The anthropometric cut-off points for adult undernutrition are based on prospective mortality and morbidity of individuals mostly conducted in populations of nonIndian ancestry and may not be appropriate for Indians23. Similarly, it may be possible that Indians are more adapted to lower values of these measures against mortality and morbidity. This is probably because of containing relatively more body fat in general and in the waist region than the Westerners. Indians may be classified as ‘normal’ by BMI level, while they are metabolically obese considering their abdominal fat24. The other widely used measure is MUAC, which is a reliable measure of undernutrition among all age groups. It is simpler to measure than BMI and has been shown to be particularly effective in the determination of malnutrition among adults in developing countries. It can be used as a substitute for BMI when rapid screening of an adult population is required as a prelude to targeting help for the undernourished25. The relationship between overall adiposity (measured as BMI) and regional adiposity measured as body circumferences like MUAC and skin folds varies across ethnic groups26. However, although an MUAC value < 23 and 24 cm, for the male and female respectively, has been recommended for use to define undernutrition 25, this value does not seem to be the most appropriate cut-off point in all ethnic groups. A study from Nigeria27 reported that a MUAC cut-off point of 23 cm was optimal for the north of the country, while a 24 cm cut-off point was more appropriate for the south. In eastern Indian tribal and non-tribal males, a cut-off value around 24 cm has been proposed to be most appropriate corresponding to 18.5 kg/m2 of BMI and also to the incidence of reported morbidity6,28. The probable reason may lie in the fact that persons of South Asian origin (including Indians) have higher levels of regional adiposity, e.g. skinfold fat (irrespective of BMI), compared to other ethnic groups 26. Thus, there is a need to establish ethnicspecific cut-off points of MUAC as well. Unfortunately, hitherto, internationally accepted cut-off points are still in use in India due to lack of prospective studies to establish appropriate age and population-specific cut-offs. What is of much interest is that the Indians have, in general, lower BMI than Caucasians at the same level of body fat content. In other words, at a given BMI level, Indians tend to have higher level of body fat compared to Caucasians 29. The health risks (coronary heart disease, noninsulin dependent diabetes mellitus, etc.) of overweight and obesity are also much more pronounced in Indians even at lower levels of BMI30. It is noteworthy that the people of South Asian origin (Indian, Pakistani and Bangladeshi) have much higher rates of coronary heart disease, stroke and non-insulin dependent diabetes mellitus than most other ethnic groups instead of having lower BMI. This has been reported from diverse parts of the world including USA31, the UK32, Fiji33, South Africa 34, Mauritius 35, West Indies36 and Southeast Asia37. In view of this low BMI versus high body fat paradox, the upper limits of BMI, i.e. overweight and obesity grades have been lowered (Table 1) for Indians 38. As mentioned above, Indians have pronounced higher levels of PBF compared to Caucasians even at the same level of BMI30. However, the cut-off points for obesity as a health risk using PBF (conventionally, 35% in females and 25% in males) have not been lowered for Indians. There is a strong justification for the reduction of these upper limits of PBF for Indians. Central obesity (more pronounced fat in the abdominal region) is another state of malnutrition causing serious health implications with regard to metabolic syndrome (MS)39, cardiovascular disease (CVD) 40 and other cardiovascular risk factors, e.g. hypertension 41. The associations of several indicators of central CURRENT SCIENCE, VOL. 106, NO. 5, 10 MARCH 2014 obesity like WHR42, CI43, WHTR44 and WC45 with CVD and MS have been studied using internationally accepted cutoff points. In cases of WHR and WC, ethnic-specific cut-off values for Indians have been proposed46,47. However, in the case of WHTR and CI, the cut-off points are yet to be modified for Indians. From the above, it is amply clear that in some measures of overnutrition (BMI, WC and WHR), the anthropometric cutoff points have been altered for Indians or South Asians, by apex international bodies, like WHO. However, in case of undernutrition, no such modifications have been made. We believe that if the lower levels of anthropometric cut-off points are made ethnic-specific for Indians, the prevalence of various indicators of undernutrition may change significantly. There remains, however, a possibility that the regional and central governments may take some political advantage through the new statistics of reduced undernutrition. Nevertheless, through a reduction of possible misclassification we should expect to utilize our limited resource more effectively and the most vulnerable will be benefited in a more efficient manner. Thus we propose that longitudinal (prospective) studies be undertaken to understand the growth process in Indian children with due consideration of the differential adaptive response of the mother–child unit in diversified ecological circumstances, including socio-economic determinants of resources. This may help determine the more biologically appropriate ethnicspecific cut-off points of various indicators of undernutrition in this country of great ethnic diversity. 1. Khongsdier, R., Hum. Ecol., 2006, 14, 39–47. 2. Chen, C. H. C., Schilling, L. S. and Lyder, C. H., J. Adv. Nurs., 2001, 36, 131–142. 3. WHO, Report of a WHO Expert Committee. Technical Report Series No. 854. World Health Organization, Geneva, 1995. 4. Troiano, R. P., Frongillo, E. A., Sobal, L. and Levitsky, D. A., Int. J. Obes. Relat. Metab. Disord., 1996, 20, 63–75. 5. Khongsdier, R., Eur. J. Clin. Nutr., 2002, 56, 484–489. 6. Chakraborty, R., Bose, K. and Koziel, S., Rural Remote Health (online), 2011, 11, 1754. 7. Chakraborty, R. and Bose, K., Malayas J. Nutr., 2012, 18(3), 319–332. 671 COMMENTARY 8. Bose, K. and Chaudhuri, A. B., Anthropol. Anz., 2003, 61(3), 311–321. 9. Cole, T. J., Bellizzi, M. C., Flegal, K. M. and Dietz, W. H., Br. Med. J., 2000, 320(7244), 1240–1243. 10. Cole, T. J., Flegal, K. M., Nicholls, D. and Jackson, A. A., Br. Med. J., 2007, 335(7612), 194. 11. International Institute of Population Sciences and Macro International, National Family Health Survey (NFHS-3, 2005– 06) India: Volume I. IIPS, Mumbai, 2007. 12. Report, UNICEF, Tracking progress on child and maternal nutrition: a survival and development priority, UNICEF, New York, 2009. 13. Bisai, S., Khongsdier, R., Bose, K. and Mahalanabis, D., Nat. Prec., 2012; hdl: 10101/hpre.2012.7106.1. Posted 2 April 2012. 14. Report, The Situation of Children in India: A Profile, UNICEF, New Delhi, 2011. 15. Panagariya, A., Econ. Polit. Wkly., 48(18), 98–111. 16. Wells, J. C. K., J. Theor. Biol., 2003, 221, 143–161. 17. Bisai, S., Mahalanabis, D., Sen, A., Bose, K. and Datta, A., Ann. Hum. Biol., 2007, 34(1), 91–101. 18. Moser, K., Stanfield, K. M. and Leon, D. A., Health Stat. Q., 2008, 22–31, 34–55. 19. Yajnik, C. S. et al., Int. J. Obes., 2003, 27, 173–180. 20. Stanfield, K. M., Wells, J. C., Fewtrell, M. S., Frost, C. and Leon, D. A., Int. J. Epidemiol., 2012, 41, 1409–1418. 21. Nube, M., Asenso Okyere, W. K.. and van den Bloom, G. J. M., Eur. J. Clin. Nutr., 1998, 77, 1186–1191. 22. Shetty, P. S. and James, W. P. T., Food and Nutrition Paper No. 50, FAO, Rome, 1994. 672 23. Sauvaget, C., Ramadas, K., Thomas, G., Vinoda, J., Thara, S. and Sankarnarayanan, R., Int J. Epidemiol., 2008, 37(5), 990–1004. 24. Sauvaget, C., In Handbook of Anthropometry: Physical Measures of Human Form in Health and Disease (ed. Preedy, V. A.), Springer Link, UK, 2012, pp. 2697–2706. 25. James, W. P., Mascie- Taylor, C. G. N., Norgan, N. G., Bistrian, B. R., Shetty, P. S. and Ferro- Luzzi, A., Eur. J. Clin. Nutr., 1994, 48, 883–894. 26. Bose, K., Anthropol. Anz., 2001, 59, 275–282. 27. Olukoya, A. A., Int. J. Gynaecol. Obstet., 1999, 31(3), 231–235. 28. Chakraborty, R., Bose, K. and Bisai, S., In Appetite and Nutritional Assessment (eds Ellsworth, S. J. and Schuster, R. C.), NOVA Science, New York, 2009, pp. 377–385. 29. Deurenberg- Yap, M., Schmidt, G., van Staveren, W. A. and Deurenberg, P, Int. J. Obes. Relat. Metab. Disord., 2000, 24, 1011–1017. 30. Yajnik, C. S., Int. J. Epidemiol., 2001, 30, 57–59. 31. Mohanty, S. A., Woolhandler, S., Himmelstein, D. U. and Bor, D. H., Gen. Intern. Med., 2005, 20, 474–478. 32. Bose, K. and Mascie- Taylor, C. G. N., Ann. Hum. Biol., 1998, 25, 11. 33. Tuomilehto, J., Ram, P., Eseroma, R., Taylor, R. and Zimmet, P., Bull. WHO, 1984, 62, 133–143. 34. Seedat, Y. K., Br. J. Diabetes Vasc. Dis., 2005, 5, 249–251. 35. Soderberg, S. et al., Diabetes Care, 2010, 33(9), 1983–1989. 36. Oldroyd, J., Banerjee, M., Heald, A. and Cruickshank, K., Postgrad. Med. J., 2005, 81, 486–490. 37. Ueshima, H., J. Atheroscler. Thromb., 2007, 14, 278–286. 38. WHO, WHO Expert Consultation, Lancet, 2004, 363, 157–163. 39. Lear, S. A., James, P. T., Ko, G. T. and Kumanyika, S., Eur. J. Clin. Nutr., 2010, 64, 42–61. 40. Nicklas, B. J. et al., Am. J. Epidemiol., 2004, 160, 741–749. 41. Chakraborty, R., Bose, K. and Koziel, S., Ann. Hum. Biol., 2011, 38(6), 669– 675. 42. Canoy, D. et al., Circulation, 2007, 116(25), 2933–2243. Epub, 10 December 2007. 43. Valdez, R., Seidell, J. C., Ahn, Y. I. and Weiss, K. M., Int. J. Obes., 1991, 17, 77–82. 44. Gruson, E. et al., Heart, 2010, 96(2), 136–140. 45. Lean, M. E., Han, T. S. and Morrison, C., Br. Med. J., 1995, 311, 158–161. 46. Misra, A., Vikram, N. K., Gupta, R., Pandey, R. M., Wasir, J. S. and Gupta, V. P., Int. J. Obes. (London), 2006, 30(1), 106–111. 47. Alberti, K. G. M. M. et al., Circulation, 2009, 120, 1640–1645. ACKNOWLEDGEMENT. We thank Dr Abhijit Guha Department of Anthropology, Vidyasagar University, for encouragement. Raja Chakraborty* is in the Department of Anthropology, Dinabandhu Mahavidyalaya, Bongaon, North 24 Parganas 743 235, India and Kaushik Bose is in the Department of Anthropology, Vidyasagar University, Midnapore, India. *e-mail: rajanth2003@yahoo.co.uk CURRENT SCIENCE, VOL. 106, NO. 5, 10 MARCH 2014


