How do you value a cross-border investment? Q3 2013
August 2013
How do you value a crossborder investment?
Q3 2013
As part of Grant Thornton we, in the Complex Asset Valuations Advisory
Services (CAVAS) team, are often asked by clients "how do you value a crossborder acquisition or project?". This periodic publication aims to address this
question by providing the results of our empirical study for the international cost
of capital and through this, present benchmark parameters for companies
operating in several countries.
In a world where all markets are fully integrated
and accessible, investing abroad is measured by the
expected return of financial assets on a world
market portfolio. In a global environment,
investors need to be compensated for their
exposure to foreign currency. As a consequence,
the expected return, or cost of capital, must
include the influence of exchange rates, different
tastes for consumption across countries and
barriers to foreign investment.
We, in the CAVAS team, perform an international
analysis of cost of capital, covering developed,
emerging and frontier market countries. The
analysis is carried out thanks to three different
models and the data and the methodologies
applied are compliant with the most recent
guidelines in the field of the international theory
valuation1.
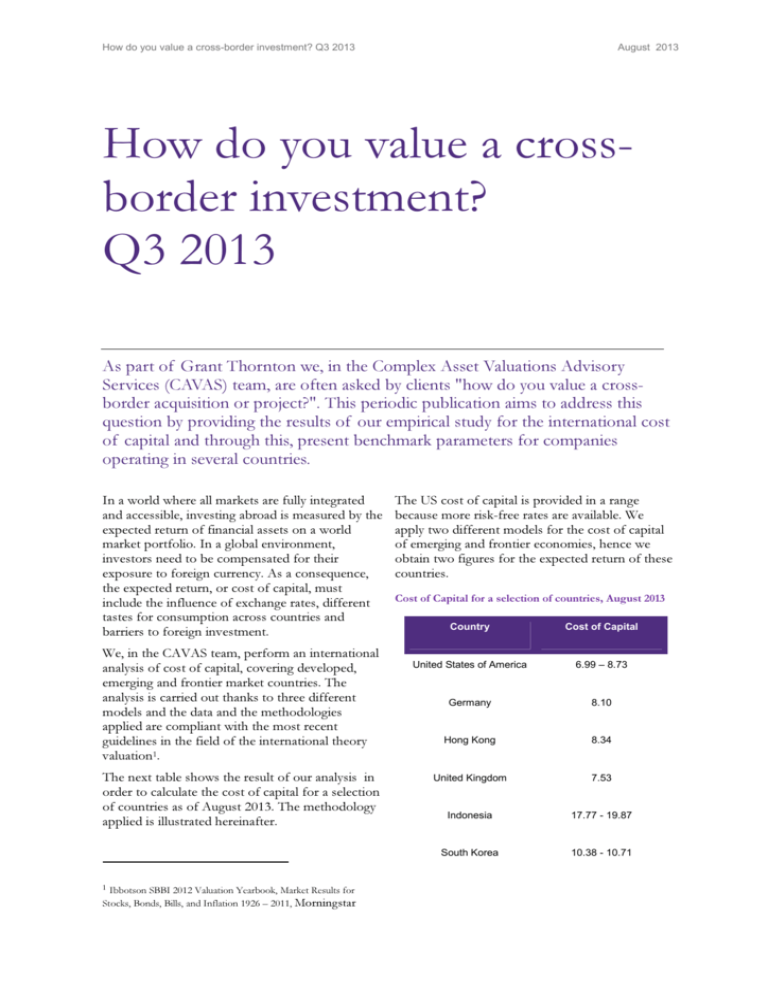
The next table shows the result of our analysis in
order to calculate the cost of capital for a selection
of countries as of August 2013. The methodology
applied is illustrated hereinafter.
1
Ibbotson SBBI 2012 Valuation Yearbook, Market Results for
Stocks, Bonds, Bills, and Inflation 1926 – 2011, Morningstar
The US cost of capital is provided in a range
because more risk-free rates are available. We
apply two different models for the cost of capital
of emerging and frontier economies, hence we
obtain two figures for the expected return of these
countries.
Cost of Capital for a selection of countries, August 2013
Country
Cost of Capital
United States of America
6.99 – 8.73
Germany
8.10
Hong Kong
8.34
United Kingdom
7.53
Indonesia
17.77 - 19.87
South Korea
10.38 - 10.71
How do you value a cross-border investment? Q3 2013
All data contained in this document are for
information purpose only.
August 2013
We then compute the cost of equity for each
country c, given the risk-free rate and the world
equity risk premium according to the relation:
= + ∗ ௐ
Methodology
The initial choice in computing the cost of capital
in an international setting, when all information is
available, is the International Capital Asset Pricing
Model (ICAPM) developed by Stulz (1981, 1995).
The application of this model depends on the
availability of the risk-free interest rate for each
country.
The next table shows our results for the beta
parameter and the equity risk premium for the US
and the world as of August 2013.
US beta, US ERP and World ERP, August 2013
ࡱࡾࡼ
ࢼ
ࡱࡾࡼ
ࢁࡿ,ࢃ
ࢁࡿ,ࢃ
ࢃ
When this data is not available, the Country Credit
Risk Model is applied. This model was formulated
5.03%
0.8926
5.63%
by Erb, Harvey and Viskanta in 1995 to overcome
the lack of data. In this context the expected return
is calculated according to the credit rating scores of
each country.
The resulting beta states that the US market is less
risky than the world market whose value is 1. For
Lastly, we propose an additional model by
the purpose of clarification, when the beta is
adjusting the ICAPM to take into account the
greater than 1, the country is considered more
possibility of the country default risk.
risky than the world market.
The international market data provided by MSCI
The following graph depicts the estimated country
Inc., formerly Morgan Stanley Capital
betas for a selection of developed countries and
International, are the main inputs of our study.
for the world.
The country risk scores are supplied by PRS
Agency and they are available for many countries
on a monthly basis back to 1984.
Estimated betas for a sample of developed countries,
August 2013
The Capital Asset Pricing Model (CAPM)
developed by Sharpe (1964) and Lintner (1965)
can be expanded to include the equity markets of
all countries of the world. To convert the CAPM
to a country-specific international format, the
model is modified so that the risk-free rate and
the beta are specific to the country being analysed
and the equity risk premium is calculated on a
worldwide basis.
We regress the MSCI US monthly returns against
the monthly returns of the world index over the
last five years and applying the arithmetic average,
which is more appropriate for an additive model
than a geometric mean. The resulting beta
parameter ௌ,ௐ is then used as an input for the
computation of the equity risk premium of the
world ௐ as follows:
ௐ = ௌ ⁄ௌ,ௐ
2.0
1.8
1.6
1.4
1.2
1.0
0.8
0.6
0.4
0.2
0
Belgium
Canada
Denmark
France
Germany
Greece
Hong Kong
Ireland
Italy
Japan
Netherlands
New Zeland
Singapore
Spain
Sweden
Switzerland
United Kingtom
United States
World
International CAPM
The highest beta is reported for Greece. Japan,
Switzerland, United Kingdom and the United
States are less risky than the world market.
We also compute the regression statistics, shown
in the next table, to obtain an indication of the
confidence level in our beta measures. In
particular, we report the minimum and maximum
How do you value a cross-border investment? Q3 2013
August 2013
value for each statistic for the period July 2008 –
August 2013 over all developed countries.
based on all countries' data and logarithmic
returns.
Statistics for developed countries,
July 2008 – August 2013
Country Risk Scores and Cost of Capital for Emerging
Markets, August 2013
intercept
beta
R squared
Emerging Markets
t-statistic
t-statistic
Country risk score
0.72 – 1.80
0.63 – 0.96
8.79 – 35.78
57.7 – 83.7
-2.43 – 2.19
Expected return
Country Credit Rating Model
A simple and forward-looking measure of risk is
the country credit rating. This measure of risk is
correlated with future equity returns and with
market volatility and it is computed taking into
account the political, financial and economic
information for each country.
The Country Credit Risk Model (CCRM) is based
on a regression model that relates market returns
with country credit ratings. The rating is the
independent variable and the historical equity
returns are the dependent variable. The expected
return of the country c in the period t is given by
= + ୡ,௧ିଵ ௧ିଵ + where is the regression intercept, ୡ,௧ିଵ is the
regression coefficient for the country credit rating
of the prior period, ௧ିଵ is the country credit
rating in the prior period − 1 and is the error
term of the regression.
The above regression equation allows us to
estimate the expected return of any country, given
its country rating, regardless of whether the
country has available return data.
We are also able to compute the expected return
for each country according to different benchmark
markets. For example, the expected return for
Argentina (classified as a frontier market) is
obtained based on all countries' data and on
frontiers' markets.
The following tables show the minimum and the
maximum values of the country risk scores and the
expected return for the emerging and frontier
markets, respectively. The regression results refer
to the period February 1984 – August 2013 and are
26.44% – 10.93%
Country Risk Scores and Cost of Capital for Frontier
Markets, August 2013
Frontier Markets
Country risk score
Expected return
55.5 – 68
28.3% – 8.67%
Modified International CAPM
We suggest modifications to the standard ICAPM
to capture the potential default risk of the country,
which is especially important for emerging and
frontier markets.
The credit spread (CS) is added to reflect the credit
quality of each country and its maturity is chosen
according to the risk-free interest rate as follows:
ୡ = + ∗ ௐ +
The traditional ICAPM beta can be modified to
deal with low correlation of markets across
countries. The adjusted beta for each country is
given by
= ∗ ⁄ௌ
where σ is the volatility and ρ is the correlation
parameter. This adjustment allows us to avoid a
double-counting error in the sense that economic
and political developments may affect a country's
credit spread and the volatility of its equity market.
How do you value a cross-border investment? Q3 2013
August 2013
Why Grant Thornton?
Grant Thornton is one of the world's leading organisation of independent assurance, tax and advisory
firms. These firms help dynamics organisations unlock their potential for growth by providing
meaningful, forward-thinking advice. Proactive teams, led by approachable partners in these firms, use
insights, experience and instinct to understand complex issues for privately owned, publicly and public
sector clients and help them to find solutions. More than 38,000 Grant Thornton people, across over
100 countries, are focused on making a difference to clients, colleagues and the communities in which
we live and work. The UK Grant Thornton member firm provides services to over 40,000 privately
held business public interest entities and individuals. It is led by more than 185 partners and employs
nearly 4,200 of the profession's brightest minds.
Why CAVAS?
We are financial engineering, modelling and valuation professionals, with advanced degrees in
quantitative disciplines and practical experience in the analysis and valuation of complex and illiquid
assets. Our team has access to software packages and programming languages as well as marketleading databases, which allow us to produce valuations of portfolios of securities.
Furthermore we always customise our offering to provide you with a cost-effective and appropriate
solution that reflects the level of service you require. We have the ability to model and value complex
securities and provide you with all key measures of risk.
Key Contacts
Dr James Dimech-DeBono
CAVAS Lead Partner
Cevik Erbay
Associate Director
Fernanda D'Ippoliti
Manager
T +44 (0)207 865 2595
E james.dimech-debono@uk.gt.com
T +44 (0)207 865 2477
E cevik.erbay@uk.gt.com
T +44 (0)207 184 4431
E fernanda.dippoliti@uk.gt.com
© 2013 Grant Thornton UK LLP. All rights reserved.
‘Grant Thornton’ means Grant Thornton UK LLP, a limited liability partnership. Grant Thornton is a member firm of Grant Thornton
International Ltd (Grant Thornton International). References to ‘Grant Thornton’ are to the brand under which the Grant Thornton
member firms operate and refer to one or more member firms, as the context requires. Grant Thornton International and the member
firms are not a worldwide partnership. Services are delivered independently by member firms, which are not responsible for the services
or activities of one another. Grant Thornton International does not provide services to clients. This publication has been prepared only
as a guide. No responsibility can be accepted by us for loss occasioned to any person acting or refraining from acting as a result of any
material in this publication.
www.grant-thornton.co.uk


