AP Microeconomics Review of Graphs and Models You need to
AP Microeconomics Review of Graphs and Models
You need to know how to draw, label and interpret all of the graphs below. You also need to be able to understand how shifts will change the graph.
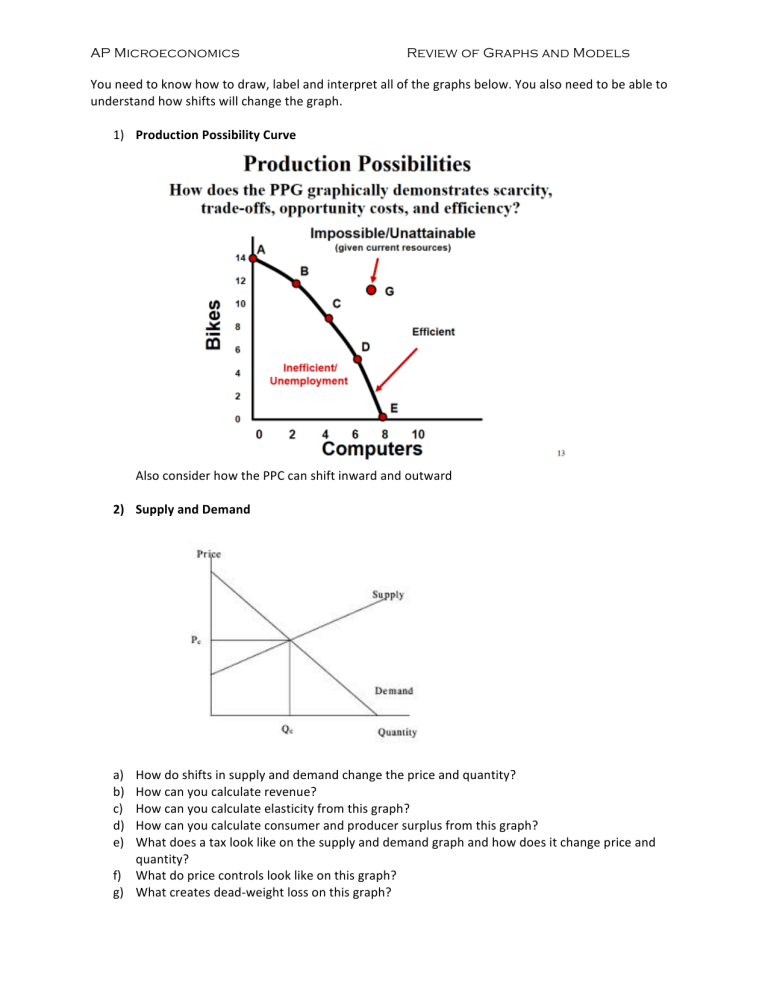
1) Production Possibility Curve
Also consider how the PPC can shift inward and outward
2) Supply and Demand
a) How do shifts in supply and demand change the price and quantity? b) How can you calculate revenue? c) How can you calculate elasticity from this graph? d) How can you calculate consumer and producer surplus from this graph? e) What does a tax look like on the supply and demand graph and how does it change price and quantity? f) What do price controls look like on this graph? g) What creates dead-‐weight loss on this graph?
3) Production Function
A.
What are the three stages of returns?
B.
Why does diminishing returns occur?
4) Short Run Costs Curves
a) What does each curve represent? b) How can you calculate average fixed cost at a given quantity? c) Why does marginal cost have the shape that it does
5) Long Run Costs Curves a) What is the difference between economies and diseconomies of scale? b) How is the Long Run Average Total Cost Curve created?
6) Industry and Firm in Perfect Competition
a) Why is Marginal Revenue equal to price and equal to demand for the firm? b) How does the industry set the price? c) How does a firm choose how much to produce? d) How can you calculate profit? e) When should a firm shut down in the short run? f) When should a firm shut down in the long run? g) What will price end up being in the long run?
7) Labor Supply and Demand (Industry and Firm)
a) What are shifters of labor supply and demand? b) How does the supply and demand of labor curves relate to marginal revenue product and marginal resource cost? c) At what point will a firm stop employing new factors?
8) Monopoly
You should be able:
Draw the above graph a) Determine price and quantity for a profit maximizer b) Determine total revenue, total cost, profits and losses c) Determine consumer surplus, producer surplus and dead weight d) Determine the quantity and revenue for a perfect price discriminating monopoly e) Determine the socially optimal quantity f) Determine where the demand curve is elastic, inelastic or unit elastic
9) Monopolistic Competition
D
You should be able: a) Do all of the same tasks as for a monopoly. b) Determine whether this is a short run or long run graph c) Determine where excess capacity exists d) Determine how demand shifts if there are short run profits or losses.
10) Externalities
Negative Externalities
Positive Externalities
a) What are examples of both positive and negative externalities? b) Why does a negative externality affect the costs (supply curve) and positive externality affect the benefits (demand curve)? c) How does the market generated quantity and price differ from the social optimum? d) What deadweight loss is created? (Hint: The triangle of negative DWL points towards the negative number line. The triangle of the positive DWL points towards only positive numbers.) e) How can a PER-‐UNIT Pigouvian tax or subsidy correct for this market failure? f) Why doesn’t a lump-‐sum tax/subsidy correct for this market failure?
