Industry Analysis Analyzing your industry helps provide a baseline
advertisement
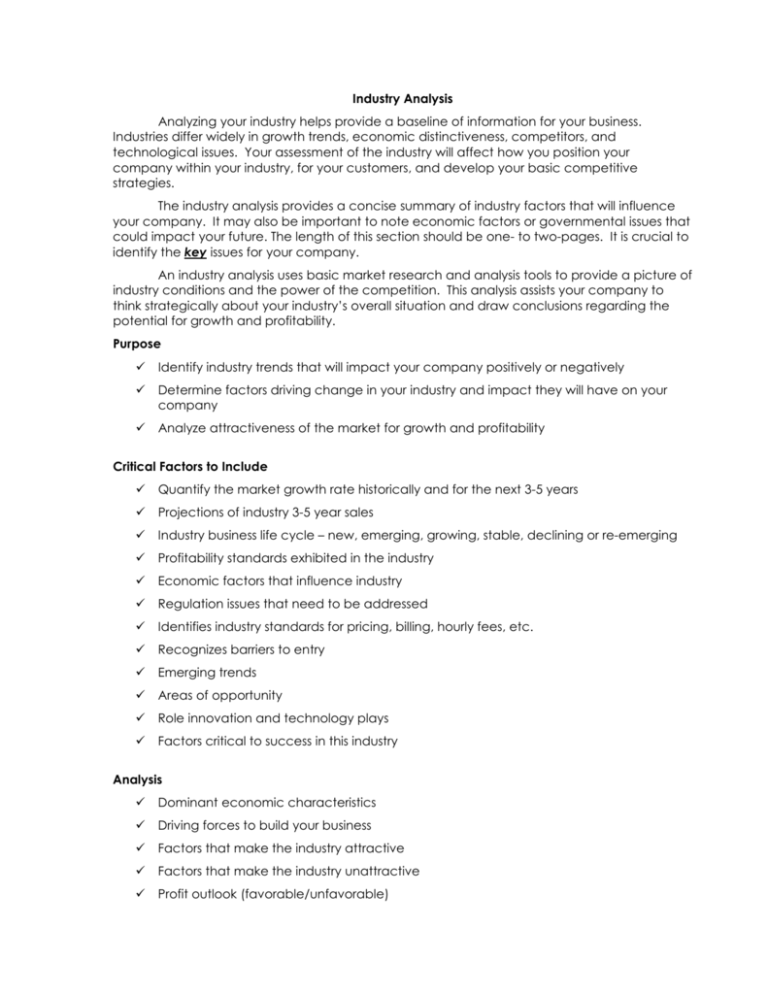
Industry Analysis Analyzing your industry helps provide a baseline of information for your business. Industries differ widely in growth trends, economic distinctiveness, competitors, and technological issues. Your assessment of the industry will affect how you position your company within your industry, for your customers, and develop your basic competitive strategies. The industry analysis provides a concise summary of industry factors that will influence your company. It may also be important to note economic factors or governmental issues that could impact your future. The length of this section should be one- to two-pages. It is crucial to identify the key issues for your company. An industry analysis uses basic market research and analysis tools to provide a picture of industry conditions and the power of the competition. This analysis assists your company to think strategically about your industry’s overall situation and draw conclusions regarding the potential for growth and profitability. Purpose Identify industry trends that will impact your company positively or negatively Determine factors driving change in your industry and impact they will have on your company Analyze attractiveness of the market for growth and profitability Critical Factors to Include Quantify the market growth rate historically and for the next 3-5 years Projections of industry 3-5 year sales Industry business life cycle – new, emerging, growing, stable, declining or re-emerging Profitability standards exhibited in the industry Economic factors that influence industry Regulation issues that need to be addressed Identifies industry standards for pricing, billing, hourly fees, etc. Recognizes barriers to entry Emerging trends Areas of opportunity Role innovation and technology plays Factors critical to success in this industry Analysis Dominant economic characteristics Driving forces to build your business Factors that make the industry attractive Factors that make the industry unattractive Profit outlook (favorable/unfavorable) The use of graphs and charts is an excellent way to illustrate the data gathered on the industry. The use of graphs and charts also makes your information more user friendly and provides variety for the reader. The following areas provide ideas for basic information to include: Describe the industry: Past & future growth of the industry: (for example) Industry Current Last 2-5 Year Next Projected Information Year Year History Year Growth Total Revenue Total units sold Total Employment Profit Margin Rate Industry Growth Rate (%/yr.) Top industry trends identified are (overall attractiveness and unattractiveness): 1. 2. 3. Top areas of opportunity-emerging trends (profit outlook) 1. 2. 3.

