IDEAL GAS LAW ACTIVITY phet
advertisement
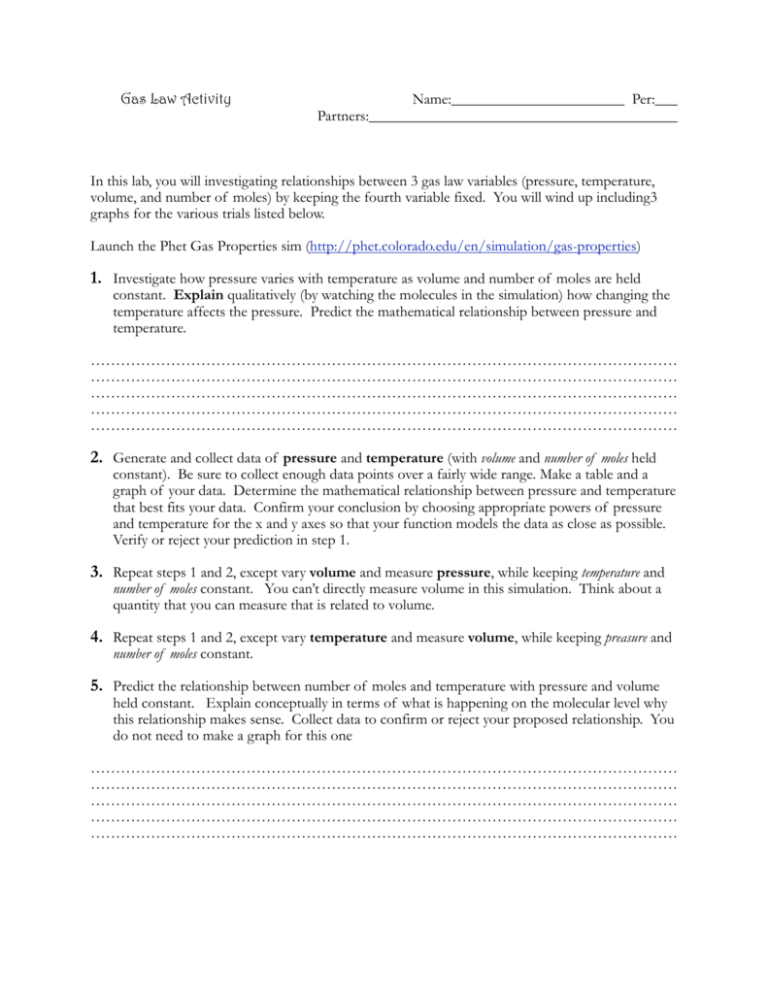
Gas Law Activity Name:_______________________ Per:___ Partners:_________________________________________ In this lab, you will investigating relationships between 3 gas law variables (pressure, temperature, volume, and number of moles) by keeping the fourth variable fixed. You will wind up including3 graphs for the various trials listed below. Launch the Phet Gas Properties sim (http://phet.colorado.edu/en/simulation/gas-properties) 1. Investigate how pressure varies with temperature as volume and number of moles are held constant. Explain qualitatively (by watching the molecules in the simulation) how changing the temperature affects the pressure. Predict the mathematical relationship between pressure and temperature. ……………………………………………………………………………………………………… ……………………………………………………………………………………………………… ……………………………………………………………………………………………………… ……………………………………………………………………………………………………… ……………………………………………………………………………………………………… 2. Generate and collect data of pressure and temperature (with volume and number of moles held constant). Be sure to collect enough data points over a fairly wide range. Make a table and a graph of your data. Determine the mathematical relationship between pressure and temperature that best fits your data. Confirm your conclusion by choosing appropriate powers of pressure and temperature for the x and y axes so that your function models the data as close as possible. Verify or reject your prediction in step 1. 3. Repeat steps 1 and 2, except vary volume and measure pressure, while keeping temperature and number of moles constant. You can’t directly measure volume in this simulation. Think about a quantity that you can measure that is related to volume. 4. Repeat steps 1 and 2, except vary temperature and measure volume, while keeping preasure and number of moles constant. 5. Predict the relationship between number of moles and temperature with pressure and volume held constant. Explain conceptually in terms of what is happening on the molecular level why this relationship makes sense. Collect data to confirm or reject your proposed relationship. You do not need to make a graph for this one ……………………………………………………………………………………………………… ……………………………………………………………………………………………………… ……………………………………………………………………………………………………… ……………………………………………………………………………………………………… ………………………………………………………………………………………………………
