Fan Cart Activity #2
advertisement
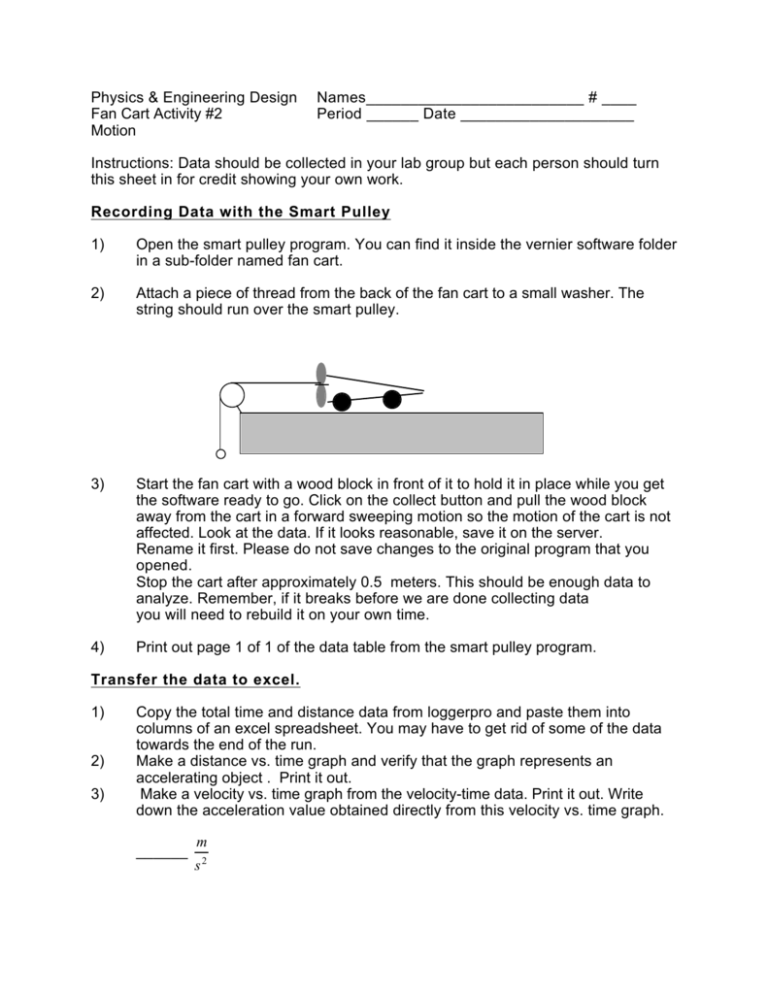
Physics & Engineering Design Fan Cart Activity #2 Motion Names_________________________ # ____ Period ______ Date ____________________ Instructions: Data should be collected in your lab group but each person should turn this sheet in for credit showing your own work. Recording Data with the Smart Pulley 1) Open the smart pulley program. You can find it inside the vernier software folder in a sub-folder named fan cart. 2) Attach a piece of thread from the back of the fan cart to a small washer. The string should run over the smart pulley. 3) Start the fan cart with a wood block in front of it to hold it in place while you get the software ready to go. Click on the collect button and pull the wood block away from the cart in a forward sweeping motion so the motion of the cart is not affected. Look at the data. If it looks reasonable, save it on the server. Rename it first. Please do not save changes to the original program that you opened. Stop the cart after approximately 0.5 meters. This should be enough data to analyze. Remember, if it breaks before we are done collecting data you will need to rebuild it on your own time. 4) Print out page 1 of 1 of the data table from the smart pulley program. Transfer the data to excel. 1) 2) 3) Copy the total time and distance data from loggerpro and paste them into columns of an excel spreadsheet. You may have to get rid of some of the data towards the end of the run. Make a distance vs. time graph and verify that the graph represents an accelerating object . Print it out. Make a velocity vs. time graph from the velocity-time data. Print it out. Write down the acceleration value obtained directly from this velocity vs. time graph. ______ m s2 Some Questions and Calculations 1) 2) How does you acceleration compare with acceleration numbers taken directly off of the smart pulley data sheet? ____________________________________________________________ Look at your distance vs. time graph. How will your teacher know by looking at it that your fan cart did indeed accelerate? ____________________________________________________________ 3) How did you obtain the fan cart's acceleration from the velocity vs. time graph? ____________________________________________________________ m s2 4) Write down ( again) the acceleration of your cart _______ 5) How fast will your fan cart be travelling after 5 seconds? Assume it starts from rest. Show the equation or method used and all work. 6) Convert your answer from the previous problem into 7) Convert 65 8) How long would it take your fan cart to accelerate to 65 miles meters into hour sec ond resistance and it could travel straight! 9) miles hour miles assuming no air hour Attach the following to this sheet and submit: 1printout of the smart pulley data, 1 graph of distance vs. time, 1 graph of velocity vs. time


