STATISTICS ON BULLYING
ADL’s A WORLD OF DIFFERENCE® Institute
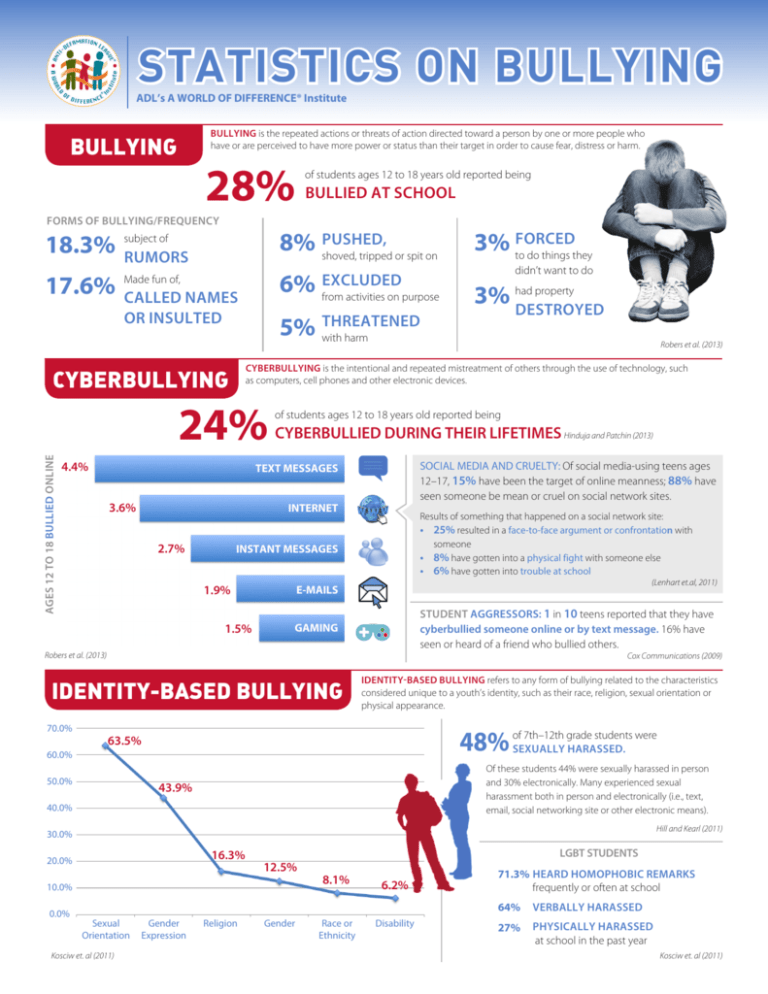
BULLYING is the repeated actions or threats of action directed toward a person by one or more people who
have or are perceived to have more power or status than their target in order to cause fear, distress or harm.
BULLYING
28%
FORMS OF BULLYING/FREQUENCY
18.3%
subject of
17.6%
Made fun of,
RUMORS
BULLIED AT SCHOOL
PUSHED,
8% shoved,
tripped or spit on
3% toFORCED
do things they
6% from activities on purpose
didn’t want to do
EXCLUDED
CALLED NAMES
OR INSULTED
THREATENED
5% with
harm
24%
4.4%
3.6%
CYBERBULLIED DURING THEIR LIFETIMES Hinduja and Patchin (2013)
SOCIAL MEDIA AND CRUELTY: Of social media-using teens ages
12–17, 15% have been the target of online meanness; 88% have
seen someone be mean or cruel on social network sites.
INTERNET
Results of something that happened on a social network site:
• 25% resulted in a face-to-face argument or confrontation with
someone
• 8% have gotten into a physical fight with someone else
• 6% have gotten into trouble at school
INSTANT MESSAGES
1.9%
1.5%
(Lenhart et.al, 2011)
E-MAILS
STUDENT AGGRESSORS: 1 in 10 teens reported that they have
cyberbullied someone online or by text message. 16% have
seen or heard of a friend who bullied others.
GAMING
Robers et al. (2013)
Cox Communications (2009)
IDENTITY-BASED BULLYING
70.0%
Robers et al. (2013)
of students ages 12 to 18 years old reported being
TEXT MESSAGES
2.7%
property
3% had
DESTROYED
CYBERBULLYING is the intentional and repeated mistreatment of others through the use of technology, such
as computers, cell phones and other electronic devices.
CYBERBULLYING
AGES 12 TO 18 BULLIED ONLINE
of students ages 12 to 18 years old reported being
IDENTITY-BASED BULLYING refers to any form of bullying related to the characteristics
considered unique to a youth’s identity, such as their race, religion, sexual orientation or
physical appearance.
7th–12th grade students were
48% ofSEXUALLY
HARASSED.
63.5%
60.0%
50.0%
Of these students 44% were sexually harassed in person
and 30% electronically. Many experienced sexual
harassment both in person and electronically (i.e., text,
email, social networking site or other electronic means).
43.9%
40.0%
Hill and Kearl (2011)
30.0%
16.3%
20.0%
12.5%
10.0%
0.0%
Sexual
Orientation
Kosciw et. al (2011)
Gender
Expression
Religion
Gender
LGBT STUDENTS
8.1%
Race or
Ethnicity
6.2%
Disability
71.3% HEARD HOMOPHOBIC REMARKS
frequently or often at school
64%
VERBALLY HARASSED
27%
PHYSICALLY HARASSED
at school in the past year
Kosciw et. al (2011)
REPORTING
47%
OF HIGH SCHOOL STUDENTS TOLD NOBODY AT ALL
Not telling anyone is a trend that becomes more pronounced as students get
older (18% in 3rd grade to 47% in 12th). (Olweus & Limber 2010)
BULLIED, NOTIFIED AN ADULT
40% after
a school incident
ALLIES vs. BYSTANDERS
26% after an online incident
CYBERBULLIED, NOTIFIED AN ADULT
Robers (2013)
• 44% of students who witnessed a
bullying incident ignored it.
• 24% of students who witnessed
an incident made fun of the
victim.
• 30% of students told an adult
after witnessing another
student being bullied.
REASONS STUDENTS KEEP SILENT
•
•
•
•
• 44% of students witnessing
a bullying incident asked the
aggressor to stop.
Negative messages about ‘tattling” and “snitching”
Gender stereotypes
Fear of retaliation
Don’t think adults will handle well (won’t get better,
won’t do anything, etc.)
• 80% of social media-using
teens ages 12–17 say they have
defended the victim.
• 79% of social media-using
teens have told the other
person to stop being mean and
cruel.
Kowalski, et al. (2012)
• 90% of social-media using teens
who have witnessed online
cruelty say they have ignored
mean behavior. 35% have done
so frequently.
• 21% of social-media using
teens reported joining in when
witnessing online cruelty.
Davis and Nixon (2010) and Lenhart (2011)
TECHNOLOGY/USE
IMPACT
93% HAVE A COMPUTER OR ACCESS TO ONE
of teens 12 to 17 years old
• 95% go online; 70% go online daily.
• 80% are users of social media sites such as Facebook.
MOST COMMON BEHAVIORS AMONGST YOUTH WHO
ARE BULLIED ARE:
• smoking cigarettes (21%)
• drinking alcohol
• using illegal drugs
• sexual activity (35%)
• 78% have cell phones and 74% are mobile internet users,
accessing the internet via cell phones, tablets, etc.
• Sending text messages (78%) and taking pictures with cell
phones (74%) are the most popular weekly activities on
phones.
Parents of teens who are social media and cell phone users
have had conversations with their teens about safe and risky online
practices. Parents say they monitor/manage their child’s online
experiences by:
• “friending” their child on social media networks (80%)
• checking the websites they have visited (77%)
• using parental controls or other means of blocking or filtering on the
internet (54%)
• using parental controls to restrict their child’s use of a cell phone (34%)
DIGITAL ABUSE AND MENTAL HEALTH AMONGST YOUTH:
• Targets are more apt to have received treatment from a mental
health professional (14% vs. 5% of others) and are more apt to have
considered suicide (also 14% v. 5%).
Data based on youth ages 14–24
MTV and AP (2011)
MAIN EFFECTS OF CYBERBULLYING
Engaged
Students ages 11–19:
Target Aggressor in Both
Depression
14.18%
15.91%
17.84%
Anxiety
11.82%
13.55%
18.69%
Number of school abscences
5.14%
7.70%
7.85%
Lenhart et al (2011) and Madden et al (2013)
Kowalski, et al. (2012)
Sources:
Davis, S., and Nixon, C. (2010). “Youth Voice Research Project,”
Preliminary results. PA: Penn State Erie, The Behrend College.
on Social Network Sites. DC: Pew Research Center’s Internet &
American Life Project.
Hill, C. and Kearl, H. 2011. Crossing the Line: Sexual Harassment at
School. DC: American Association of University Women.
Madden, M., Lenhart, A., Dugan, M. et al. 2013. Teens and
Technology. DC: Pew Research Center’s Internet & American
Life Project.
Hinduja, S. and Patchin, J. 2013. Lifetime Cyberbullying
Victimization Rates. Cyberbullying Research Center.
Kowalski, R.M, and Limber, S.P. 2013. “Psychological, Physical,
and Academic Correlates of Cyberbullying and Traditional
Bullying.” Journal of Adolescent Health 53.
Kosciw, J. Greytak, E.A., Bartkiewicz, M.J. Boesen, M.J., and
Palmer, N.A. 2012. The 2011 National School Climate Survey: The
Experiences of Lesbian, Gay, Bisexual and Transgender Youth in Our
Nation’s Schools. NY: Gay, Lesbian & Straight Education Network.
Lenhart, A., Madden, M., et al. 2011. Teens, Kindness and Cruelty
MTV and The Associated Press. 2011 and 2013. The Digital Abuse
Study 2011 and 2013.
Robers, S., Kemp J., and Truman, J. 2013. Indicators of School
Crime and Safety: 2012. DC: National Center for Education
Statistics, U.S. Department of Education.
Olweus, D., and Limber. 2010. Olweus Bullying Questionnaire.
Cox Communications and National Center for Missing &
Exploited Children. 2009. Teen Online & Wireless Safety Survey.
Atlanta: Cox Communications.
adl.org/combatbullying
• Visit for more information on bullying.
• Download resources for educators, youth,
parents and families.
• Be an Ally. Stop Bullying.
Anti-Defamation League
Tel. 212-885-7700
education@adl.org
www.adl.org/education
© 2014 Anti-Defamation League

