S&P 500 Earnings Intellect
Trend Analysis from Global Markets Intelligence
Health Care Prognosis: Tip Top Condition
September 17, 2015
Lindsey Bell
Senior Analyst
Global Markets Intelligence
lindsey.bell@mhfi.com
Viewing Recent Pullback As More Reason To Stay The Course
August was a blood bath for the S&P 500 which declined 6.3% with none of its ten industries
left unscathed. Most unsettling was the 8.1% decline the health care sector suffered (the
largest deterioration in the index), especially as the move was not reflective of the old Wall
Street adage that states price will lead fundamentals. This price performance--or lack
thereof--occurred despite the group's outstanding second-quarter reporting season in which
growth far outpaced that of any other sector. Results and management commentary made it
evident that the fundamental story remains very much in-tact. Even as the sector has
recovered some of its August decline, we believe valuation is still more attractive than
previously and reiterate our overweight rating on the sector.
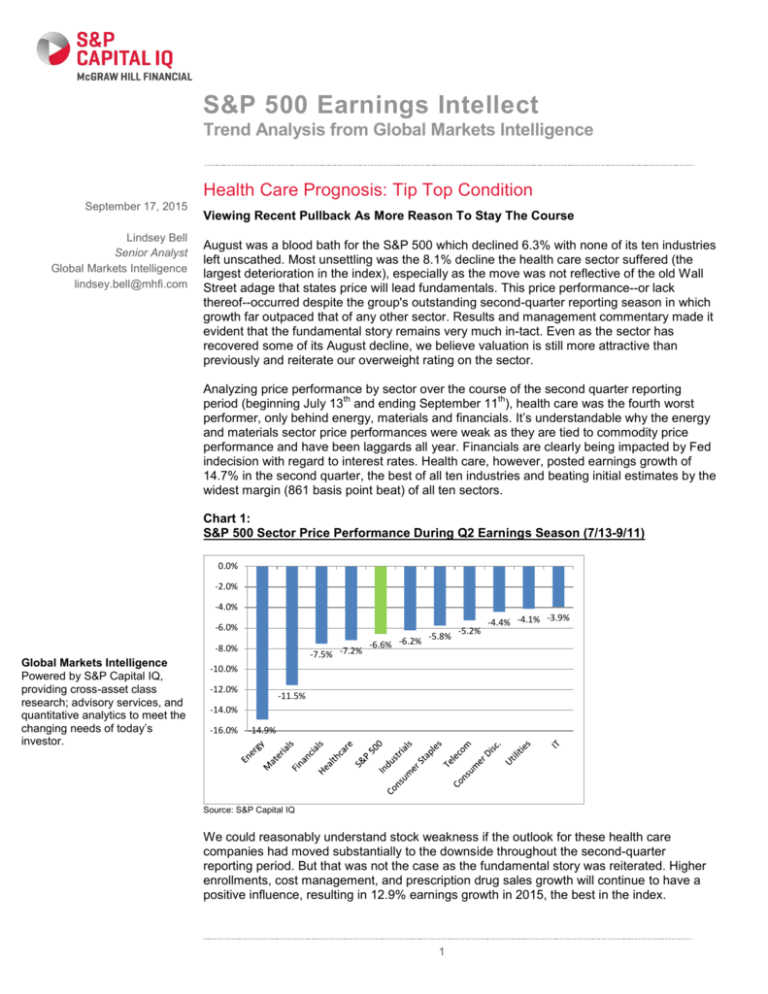
Analyzing price performance by sector over the course of the second quarter reporting
th
th
period (beginning July 13 and ending September 11 ), health care was the fourth worst
performer, only behind energy, materials and financials. It’s understandable why the energy
and materials sector price performances were weak as they are tied to commodity price
performance and have been laggards all year. Financials are clearly being impacted by Fed
indecision with regard to interest rates. Health care, however, posted earnings growth of
14.7% in the second quarter, the best of all ten industries and beating initial estimates by the
widest margin (861 basis point beat) of all ten sectors.
Chart 1:
S&P 500 Sector Price Performance During Q2 Earnings Season (7/13-9/11)
0.0%
-2.0%
-4.0%
-6.0%
-8.0%
Global Markets Intelligence
Powered by S&P Capital IQ,
providing cross-asset class
research; advisory services, and
quantitative analytics to meet the
changing needs of today’s
investor.
-7.5% -7.2%
-5.8%
-6.6% -6.2%
-5.2%
-3.9%
-4.4% -4.1%
-10.0%
-12.0%
-11.5%
-14.0%
-16.0%
-14.9%
Source: S&P Capital IQ
We could reasonably understand stock weakness if the outlook for these health care
companies had moved substantially to the downside throughout the second-quarter
reporting period. But that was not the case as the fundamental story was reiterated. Higher
enrollments, cost management, and prescription drug sales growth will continue to have a
positive influence, resulting in 12.9% earnings growth in 2015, the best in the index.
1
MARKET OBSERVATION
Health care has been a key driver of earnings growth for the past several quarters, posting
double-digit growth in each of the previous five quarters (including growth of more than 20%
in fourth-quarter 2014 and first-quarter 2015), making it hard to reconcile the sector's recent
decline. Notably, health care is still up 4.2% year-to-date, representing one of only two
sectors boasting positive growth year-to-date (consumer discretionary has appreciated
6.0%).
In March, the Department of Health and Human Services reported nearly 11.7 million people
signed up for health insurance through the exchanges, while millions more enrolled in
Medicaid. The increase in insured patients should result in higher utilization and help most
health care sub-industries report solid sales and EPS growth, though we continue to forecast
flat to slightly negative sales gains for large-cap pharma given the impact of the strong U.S.
dollar. That said we do expect the big four pharma companies (Pfizer, Merck, Bristol Meyers
and Eli Lilly) to once again post top line growth in 2016 for the first time in five years as they
pass the patent cliff. Finally, we see biotech sales growing in the mid-teens in the quarters
ahead, driven by the drugs approved in 2013 and 2014. Although this rate is much lower
than the rate of growth in 2014, we still view it as quite healthy.
Health care's 2015 earnings growth estimate has increased by the second-largest amount
since the second-quarter earnings season kicked off, largely due to the second-quarter beat
as third and fourth quarter estimates were reduced. The decreases in those quarters were
minimal, as they were the smallest reduction by any sector with the move equating to less
than 50 bps in each quarter (see table below).
Table 1:
Basis Point Change in Quarterly Growth Rates
EPS Grow th Est. Change
Q2
Energy
516 bps
Materials
384 bps
Consumer Staples
424 bps
IT
412 bps
Utilties
476 bps
Consumer Discretionary
417 bps
Industrials
-41 bps
Financials
466 bps
Healthcare
861 bps
Telecomm
582 bps
S&P 500
456 bps
from Q2 Earnings Season Start
FY 2015
Q3
Q4
FY2015 Grow th Rate
-599 bps -1,948 bps
-394 bps
-59.2%
-991 bps
-567 bps
-262 bps
-0.7%
-381 bps
-306 bps
-69 bps
0.5%
-362 bps
-165 bps
-42 bps
3.2%
-158 bps
-438 bps
-36 bps
1.7%
-303 bps
-140 bps
-10 bps
11.0%
-242 bps
250 bps
-8 bps
3.7%
-197 bps
-189 bps
23 bps
11.0%
-26 bps
-41 bps
204 bps
12.9%
299 bps
261 bps
284 bps
9.8%
-281 bps
-264 bps
-25 bps
-0.2%
Source: S&P Capital IQ
Note: Q2 earnings season start defines as July 13, 2015.
Given the lack of fundamental changes, we view the pullback in health care shares as a
profit taking exercise for investors of what was a high flying sector ahead of the market
th
plunge that began on August 20 because of worries that China's slowdown would spread.
The S&P 500 and the health care index both bottomed on August 25th. Since correcting
10.3% over that period, the sector has regained about half of that decline. Although, we still
believe it is attractively valued at 16.8x not only because it's trading at a discount to its
historic 15-year average of 17.1x but also because it's trading at its lowest multiple all year.
In addition, it’s 0.2x premium to the S&P 500 multiple is below the 1.0x premium historically
garnered by health care.
2
MARKET OBSERVATION
Table 2:
P/E Ratios by Sub-Sector vs. the Historical Average
Healthcare
25-Aug
16.7x
Today 15-yr Avg
16.8x
17.1x
Discount/Premium
to Avg
-1.9%
Pharmaceuticals, Biotechnology & Life Sciences
Biotechnology
Life Sciences Tools & Services
Pharmaceuticals
15.7x
15.3x
16.3x
15.9x
16.6x
16.4x
17.2x
16.6x
17.2x
24.2x
16.2x
16.5x
-3.7%
-32.1%
6.6%
0.7%
Health Care Equipment & Services
Health Care Technology
Health Care Equipment & Supplies
Health Care Providers & Services
16.6x
25.9x
18.0x
15.5x
17.4x
27.3x
18.2x
16.6x
16.6x
31.2x
19.3x
14.9x
4.6%
-12.6%
-5.6%
11.1%
15.3x
16.6x
16.1x
3.1%
S&P 500
Source: S&P Capital IQ
Note: The 15-year average for Life Science Tools & Service only includes data back to May 2006 and for Health Care Technology
only includes data going back to May 2010.
In addition to the fundaments discussed above, the valuations of the biotechnology,
pharmaceuticals and health care equipment sub-sectors give us confidence that upside is
especially attainable within these sub-sectors. With regards to biotechnology, the most hotly
debated of the three, it is worth nothing that the historical average P/E is outsized given the
tech bubble of the early 2000. We believed biotechnology’s valuation was reasonable before
the recent pullback as it has the best growth of any sub-sector, making the current reduced
valuation of 16.4x even more attractive as it is below the overall health care sector multiple
of 16.8x.
We entered 2015 with an overweight recommendation on the sector and we continue to
maintain that position now. Remember, according to Sam Stovall, S&P Capital IQ U.S.
Equity Strategist, the health care sector has beaten the S&P 500 in each of the past five
calendar years (including this one), something no other sector can boast.
3
MARKET OBSERVATION
Disclosures
About S&P Capital IQ’s Distributors:
S&P Capital IQ’s Research Reports have been prepared by Global Markets Intelligence (“GMI”), a business unit of S&P Capital IQ. In
the United States, Research Reports are prepared and issued by Standard & Poor’s Investment Advisory Services, LLC (“SPIAS”). In
the European Economic Area (“EEA”) States, Research Reports are distributed by McGraw-Hill Financial Research Europe
(“MHFRE”), which is authorized and regulated by the Financial Conduct Authority in the United Kingdom. Under and subject to the
Markets in Financial Instruments Directive (“MiFID”), MHFRE is entitled to exercise a passport right to provide cross border
investment advice into EEA States. MHFRE exercises its MiFID right to passport investment advice including the Research Reports
into EEA States. In Hong Kong, Research Reports are issued by Standard & Poor’s Investment Advisory Services (HK) Limited
(“SPIAS HK”), which is regulated by the Hong Kong Securities Futures Commission; in Singapore, by McGraw-Hill Financial
Singapore Pte. Limited (“MHFSPL”), which is regulated by the Monetary Authority of Singapore; Research Reports are distributed in
Malaysia, by S&P Malaysia, which is regulated by the Securities Commission of Malaysia; in Australia, by Standard & Poor’s
Information Services (Australia) Pty Ltd (“SPIS”), which is regulated by the Australian Securities & Investments Commission; and in
Japan, by McGraw-Hill Financial Japan KK (“MHF Japan”), which is registered by Kanto Financial Bureau. SPIAS, MHFRE, SPIAS
HK, MHFSPL, S&P Malaysia, SPIS and MHF Japan, each a wholly owned subsidiary of McGraw Hill Financial, Inc. operate under the
GMI brand.
S&P Capital IQ and its affiliates provide a wide range of services to, or relating to, many organizations, including issuers of securities,
investment advisers, broker-dealers, investment banks, other financial institutions and financial intermediaries, and accordingly may
receive fees or other economic benefits from those organizations, including organizations whose securities or services they may
recommend, rate, include in model portfolios, evaluate or otherwise address.
For details on the S&P Capital IQ research objectivity
https://www.spcapitaliq.com/disclaimers/s-p-capital-iq-research-reports
and
conflict-of-interest
policies,
please
visit:
General Disclosures
Notice to all jurisdictions:
Where S&P Capital IQ’s Research Reports are made available in a language other than English and in the case of inconsistencies
between the English and translated versions of a Research Report, the English version will control and supersede any ambiguities
associated with any part or section of a Research Report that has been issued in a foreign language. Neither S&P Capital IQ nor
its affiliates guarantee the accuracy of the translation. Assumptions, opinions and estimates constitute our judgment as of the date of this
material and are subject to change without notice.
Past performance is not necessarily indicative of future results.
No content (including ratings, credit-related analyses and data, valuations, model, software or other application or output therefrom) or
any part thereof (Content) may be modified, reverse engineered, reproduced or distributed in any form by any means, or stored in a
database or retrieval system, without the prior written permission of Standard & Poor’s Financial Services LLC or its affiliates
(collectively, S&P). The Content shall not be used for any unlawful or unauthorized purposes. S&P and any third-party providers, as
well as their directors, officers, shareholders, employees or agents (collectively S&P Parties) do not guarantee the accuracy,
completeness, timeliness or availability of the Content. S&P Parties are not responsible for any errors or omissions (negligent or
otherwise), regardless of the cause, for the results obtained from the use of the Content, or for the security or maintenance of any data
input by the user. The Content is provided on an “as is” basis. S&P PARTIES DISCLAIM ANY AND ALL EXPRESS OR IMPLIED
WARRANTIES, INCLUDING, BUT NOT LIMITED TO, ANY WARRANTIES OF MERCHANTABILITY OR FITNESS FOR A
PARTICULAR PURPOSE OR USE, FREEDOM FROM BUGS, SOFTWARE ERRORS OR DEFECTS, THAT THE CONTENT’S
FUNCTIONING WILL BE UNINTERRUPTED OR THAT THE CONTENT WILL OPERATE WITH ANY SOFTWARE OR
HARDWARE CONFIGURATION. In no event shall S&P Parties be liable to any party for any direct, indirect, incidental, exemplary,
compensatory, punitive, special or consequential damages, costs, expenses, legal fees, or losses (including, without limitation, lost
income or lost profits and opportunity costs or losses caused by negligence) in connection with any use of the Content even if advised of
the possibility of such damages.
While S&P Capital IQ has obtained information from sources it believes to be reliable, S&P Capital IQ does not perform an audit and
undertakes no duty of due diligence or independent verification of any information it receives.
S&P keeps certain activities of its business units separate from each other in order to preserve the independence and objectivity of their
respective activities. As a result, certain business units of S&P may have information that is not available to other S&P business units.
S&P has established policies and procedures to maintain the confidentiality of certain non-public information received in connection
with each analytical process.
Research Reports are not intended to be investment advice and do not constitute any form of invitation or inducement by S&P Capital
IQ to engage in investment activity. This material is not intended as an offer or solicitation for the purchase or sale of any security or
other financial instrument. Securities, financial instruments or strategies mentioned herein may not be suitable for all investors and this
material is not intended for any specific investor and does not take into account an investor’s particular investment objectives, financial
situations or needs. Any opinions expressed herein are given in good faith, are subject to change without notice, and are only current as
of the stated date of their issue. Prices, values, or income from any securities or investments mentioned in this report may fluctuate, and
an investor may, upon selling an investment, lose a portion of, or all of the principal amount invested. Where an investment is described
as being likely to yield income, please note that the amount of income that the investor will receive from such an investment may
fluctuate. Where an investment or security is denominated in a different currency to the investor’s chosen currency, changes in rates of
exchange may have an adverse effect on the value, price or income of or from that investment to the investor. The information
contained in Research Reports does not constitute advice on the tax consequences of making any particular investment decision. Before
acting on any recommendation in this material, you should consider whether it is suitable for your particular circumstances and, if
necessary, seek professional advice.
Additional information on a subject company may be available upon request.
4
MARKET OBSERVATION
Notice to all Non U.S. Residents:
S&P Capital IQ’s Research Reports may be distributed in certain localities, countries and/or jurisdictions (“Territories”) by independent
third parties or independent intermediaries and/or distributors (the “Intermediaries” or “Distributors”). Intermediaries are not acting as
agents or representatives of S&P Capital IQ. In Territories where an Intermediary distributes S&P Capital IQ’s Research Reports, the
Intermediary, and not S&P Capital IQ, is solely responsible for complying with all applicable regulations, laws, rules, circulars, codes
and guidelines established by local and/or regional regulatory authorities, including laws in connection with the distribution of thirdparty Research Reports, licensing requirements, supervisory and record keeping obligations that the Intermediary may have under the
applicable laws and regulations of the territories where it distributes the Research Reports.
Each Research Report is not directed to, or intended for distribution to or use by, any person or entity who is a citizen or resident of or
located in any locality, state, country or other jurisdiction where such distribution, publication, availability or use would be contrary to
law or regulation or which would subject S&P Capital IQ or its affiliates to any registration or licensing requirements in such
jurisdiction.
Each Research Report is not directed to, or intended for distribution to or use by, any person or entity who is not in a class qualified to
receive Research Reports (e.g., a qualified person and/or investor), as defined by the local laws or regulations in the country or
jurisdiction where the person is domiciled, a citizen or resident of, or the entity is legally registered or domiciled.
S&P Capital IQ’s Research Reports are not intended for distribution in or directed to entities, residents or investors in:
Burma, Cuba, Crimea, Czech Republic, Iran, Kuwait, Lebanon, North Korea, Portugal, Romania, Sudan, Slovakia, Syria,
Taiwan, Thailand and Turkey.
Copyright © 2015 Standard & Poor's Financial Services LLC. All rights reserved. STANDARD & POOR'S, S&P, S&P 500, S&P
EUROPE 350 and STARS are registered trademarks of Standard & Poor's Financial Services LLC. S&P CAPITAL IQ is a trademark of
Standard & Poor's Financial Services LLC.
5


![[#CARBON-7563] BPS logo is lost after front FE/BE separation](http://s3.studylib.net/store/data/007819372_2-690d6e2c7f34bc8dfa587f5b937611ef-300x300.png)
