Workplace Violence
WORKPLACE VIOLENCE
2
+7883
Many workers experience violence or the threat of violence
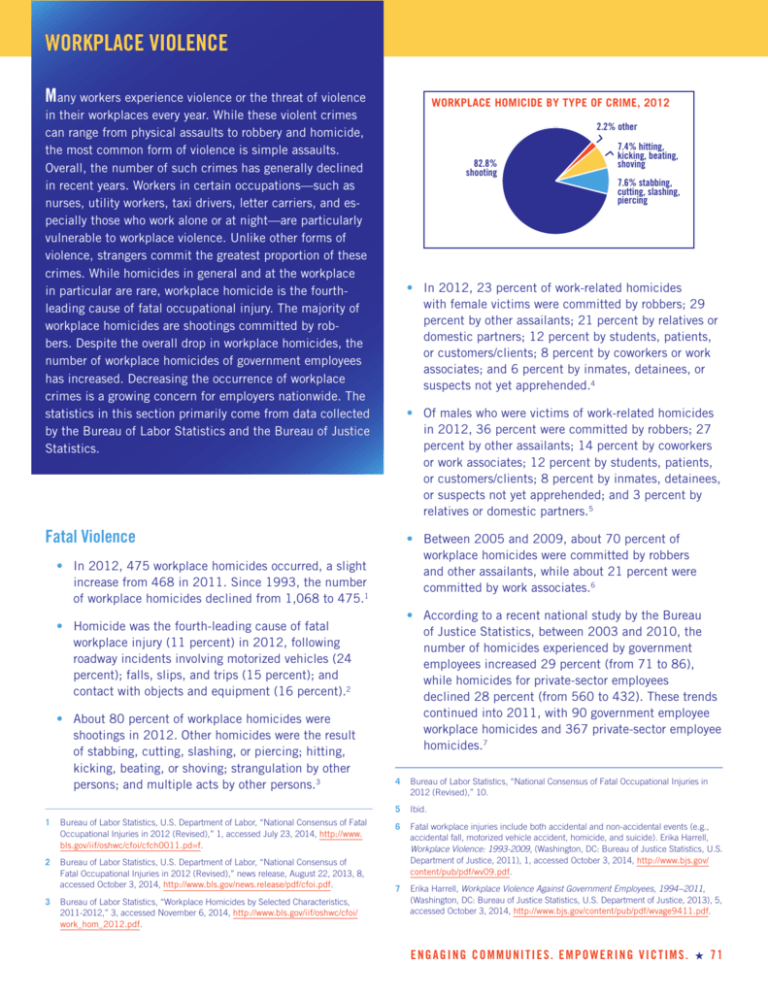
WORKPLACE HOMICIDE BY TYPE OF CRIME, 2012
in their workplaces every year. While these violent crimes
can range from physical assaults to robbery and homicide,
the most common form of violence is simple assaults.
Overall, the number of such crimes has generally declined
in recent years. Workers in certain occupations—such as
nurses, utility workers, taxi drivers, letter carriers, and especially those who work alone or at night—are particularly
vulnerable to workplace violence. Unlike other forms of
violence, strangers commit the greatest proportion of these
crimes. While homicides in general and at the workplace
in particular are rare, workplace homicide is the fourthleading cause of fatal occupational injury. The majority of
workplace homicides are shootings committed by robbers. Despite the overall drop in workplace homicides, the
number of workplace homicides of government employees
has increased. Decreasing the occurrence of workplace
crimes is a growing concern for employers nationwide. The
statistics in this section primarily come from data collected
by the Bureau of Labor Statistics and the Bureau of Justice
Statistics.
82.8%
shooting
• Between 2005 and 2009, about 70 percent of
workplace homicides were committed by robbers
and other assailants, while about 21 percent were
committed by work associates.6
• According to a recent national study by the Bureau
of Justice Statistics, between 2003 and 2010, the
number of homicides experienced by government
employees increased 29 percent (from 71 to 86),
while homicides for private-sector employees
declined 28 percent (from 560 to 432). These trends
continued into 2011, with 90 government employee
workplace homicides and 367 private-sector employee
homicides.7
• Homicide was the fourth-leading cause of fatal
workplace injury (11 percent) in 2012, following
roadway incidents involving motorized vehicles (24
percent); falls, slips, and trips (15 percent); and
contact with objects and equipment (16 percent).2
Bureau of Labor Statistics, U.S. Department of Labor, “National Consensus of Fatal
Occupational Injuries in 2012 (Revised),” 1, accessed July 23, 2014, http://www.
bls.gov/iif/oshwc/cfoi/cfch0011.pd=f.
2
Bureau of Labor Statistics, U.S. Department of Labor, “National Consensus of
Fatal Occupational Injuries in 2012 (Revised),” news release, August 22, 2013, 8,
accessed October 3, 2014, http://www.bls.gov/news.release/pdf/cfoi.pdf.
3
Bureau of Labor Statistics, “Workplace Homicides by Selected Characteristics,
2011-2012,” 3, accessed November 6, 2014, http://www.bls.gov/iif/oshwc/cfoi/
work_hom_2012.pdf.
7.6% stabbing,
cutting, slashing,
piercing
• Of males who were victims of work-related homicides
in 2012, 36 percent were committed by robbers; 27
percent by other assailants; 14 percent by coworkers
or work associates; 12 percent by students, patients,
or customers/clients; 8 percent by inmates, detainees,
or suspects not yet apprehended; and 3 percent by
relatives or domestic partners.5
• In 2012, 475 workplace homicides occurred, a slight
increase from 468 in 2011. Since 1993, the number
of workplace homicides declined from 1,068 to 475.1
1
7.4% hitting,
kicking, beating,
shoving
• In 2012, 23 percent of work-related homicides
with female victims were committed by robbers; 29
percent by other assailants; 21 percent by relatives or
domestic partners; 12 percent by students, patients,
or customers/clients; 8 percent by coworkers or work
associates; and 6 percent by inmates, detainees, or
suspects not yet apprehended.4
Fatal Violence
• About 80 percent of workplace homicides were
shootings in 2012. Other homicides were the result
of stabbing, cutting, slashing, or piercing; hitting,
kicking, beating, or shoving; strangulation by other
persons; and multiple acts by other persons.3
2.2% other
4
Bureau of Labor Statistics, “National Consensus of Fatal Occupational Injuries in
2012 (Revised),” 10.
5
Ibid.
6
Fatal workplace injuries include both accidental and non-accidental events (e.g.,
accidental fall, motorized vehicle accident, homicide, and suicide). Erika Harrell,
Workplace Violence: 1993-2009, (Washington, DC: Bureau of Justice Statistics, U.S.
Department of Justice, 2011), 1, accessed October 3, 2014, http://www.bjs.gov/
content/pub/pdf/wv09.pdf.
7
Erika Harrell, Workplace Violence Against Government Employees, 1994−2011,
(Washington, DC: Bureau of Justice Statistics, U.S. Department of Justice, 2013), 5,
accessed October 3, 2014, http://www.bjs.gov/content/pub/pdf/wvage9411.pdf.
E N G A G I N G C O M M U N I T I E S . E M P O W E R I N G V I C T I M S . 7 1 Workplace Violence
• Of those who were victims of work-place homicide in
2012, 20.8 percent were females, and 79.2 percent
were males.8
• In 2012, 28 percent of the 351 female fatal
workplace injuries were homicides compared to 9
percent of the 4,277 male fatal workplace injuries
that were homicides.9
• Of the non-fatal violent crimes committed against
victims who were working or on duty in 2008, 81.6
percent were simple assaults, 14.6 percent were
aggravated assaults, 1.9 percent were rapes or sexual
assaults, and 1.7 percent were robberies.14
VIOLENT CRIMES AGAINST VICTIMS WORKING
OR ON DUTY, 2008*
1.7% robbery
• Sales and related occupations made up 24.1
percent of workplace homicides in 2012. Protective
service occupations (including firefighters and law
enforcement officers) made up 30.3 percent of
workplace homicides.10
1.9% rape or
sexual assault
+21581
2
• Of those who were victims of workplace homicide
in 2012, 71.8 percent of the victims were wage or
salary based employees, and 29.7 percent were selfemployed.11
• Of those who were victims of workplace homicide in
2012, 21.6 percent were between the ages of 35 to
44 years, and 24.4 percent were between the ages of
45 to 54.12
Non-Fatal Violence
• In 2008, 15 percent of all non-fatal violent crimes
and 15 percent of all property crimes were committed
against victims who were at work or on duty at the
time. Of non-fatal violent crimes, these percentages
were highest for simple assaults (18 percent) and
aggravated assaults (13 percent). Of all property
crimes, these percentages were highest for household
burglaries (24 percent) and thefts (13 percent).13
14.6%
aggravated
assault
81.6%
simple assault
*Percentages do not add up to 100 due to rounding.
• The average annual rate of workplace violence
between 2005 and 2009 (5 violent crimes per 1,000
employed persons age 16 or older) was about onethird the rate of non-workplace violence (16 violent
crimes per 1,000 employed persons age 16 or older)
and violence against persons not employed (17 violent
crimes per 1,000 persons age 16 or older).15
• Strangers committed the greatest proportion of nonfatal workplace violence against males (52.9 percent)
and females (40.9 percent) between 2005 and
2009.16
NON-FATAL WORKPLACE VIOLENCE COMMITTED BY
STRANGERS, 2005 – 2009
100
percent
75
8
Bureau of Labor Statistics, “Workplace Homicides by Selected Characteristics,
2011-2012,” 1.
9
Bureau of Labor Statistics, “National Consensus of Fatal Occupational Injuries in
2012 (Revised),” 9.
52.9%
50
40.9%
25
10 Bureau of Labor Statistics, “Workplace Homicides by Selected Characteristics,
2011-2012,” 12, 15.
a
t
ins
ag
11 Ibid., 2.
les
fe
nst
ai
ag
12 Ibid.
13 Bureau of Justice Statistics, Criminal Victimization in the United States, 2008:
Statistical Tables, (Washington, DC: U.S. Department of Justice, 2010), calculated
from data in Table 64, accessed October 3, 2014, http://bjs.ojp.usdoj.gov/content/
pub/pdf/cvus08.pdf.
72 2015 NCVRW RESOURCE GUIDE
14 Ibid.
15 Harrell, Workplace Violence: 1993−2009, 1.
16 Ibid.
les
ma
ma


