Physics Department EXP. FIVE Kuwait University Course 127 The
advertisement
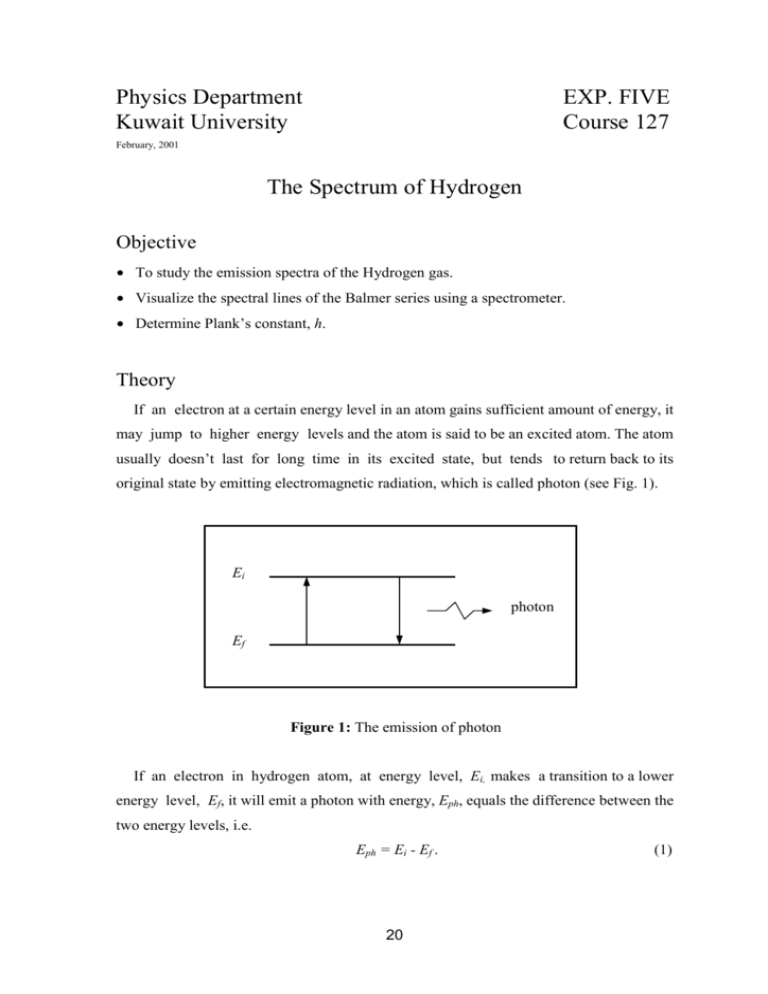
Physics Department Kuwait University EXP. FIVE Course 127 February, 2001 The Spectrum of Hydrogen Objective • To study the emission spectra of the Hydrogen gas. • Visualize the spectral lines of the Balmer series using a spectrometer. • Determine Plank’s constant, h. Theory If an electron at a certain energy level in an atom gains sufficient amount of energy, it may jump to higher energy levels and the atom is said to be an excited atom. The atom usually doesn’t last for long time in its excited state, but tends to return back to its original state by emitting electromagnetic radiation, which is called photon (see Fig. 1). Ei photon Ef Figure 1: The emission of photon If an electron in hydrogen atom, at energy level, Ei, makes a transition to a lower energy level, Ef, it will emit a photon with energy, Eph, equals the difference between the two energy levels, i.e. Eph = Ei - Ef . 20 (1) The energy of the emitted photon is given as Eph = hν, (2) where h is Plank’s constant, and ν is the frequency. Therefore, hν = E i − E f . (3) The energy of an energy level, n, is given as 2π 2 k 2 me 4 En = − , h2n2 (4) and the frequency, ν=c/λ, where c is the speed of light, and λ is the wavelength of the photon. Therefore, substituting for ν, and En in Eq.(3) gives h3 = 1 1 − 2 ⋅λ , 2 n ni f 2π 2 k 2 me 4 c (5) where: k is the electrostatic constant = 9 × 10⁹ Nm2 c-2, m is the electronic mass = 9 .11× 10-31 kg, e is the electronic charge = 1.6 × 10⁻¹⁹ C, c is the speed of light = 3 × 10⁸ m/s, h is the Plank's constant = 6.6256 × 10⁻³⁴ Js, nf is principle quantum number for the final energy level, ni is principle quantum number for the initial energy level. Therefore, if, for a specific transition, nf, and ni are known, Plank’s constant, h, can be determined by measuring λ for the emitted photon,. The wavelength, λ, is measured using a spectrometer (Fig. 2). It consists, mainly, of a diffraction grating, collimator, and a telescope. The collimator directs the light waves emerging through it’s slit, to the diffraction grating. The telescope, which is free to rotate through various angles, gathers the light waves emerging from the grating and directs them towards a magnifying lens at its end. The diffraction grating disperses (diffracts) the polychromatic light waves at different angles. The diffraction grating is a piece of glass with equally spaced parallel grooves being ruled on one face. When a parallel beam of polychromatic light falls on one side of the grating, each wavelength is dispersed through a specific angle θ, such that nλ=d sinθ , 21 (6) where n is order number, and d is the diffraction spacing constant. Eye piece Diffraction grating Light sourc Telescope Collimator Slit screw Figure 2: The spectrometer Eo (eV) ∝ 5 -0.5 4 -0.8 3 -1.5 Paschen Bracket 2 -3.4 Balmer 1 -13.6 Lyman Figure 3: Probable transitions in the Hydrogen atom Figure 3, shows the energy levels of hydrogen atom and the probable transitions for the electron between the levels. For each energy level there is a series of spectral lines. 22 For instance, all spectral lines produced by electron transitions from any level down to level 1 are called Lyman series. As shown in Fig. 3, there are four series in the hydrogen spectrum. They are Lyman, Balmer, Paschen, and Bracket series. In this experiment, the Balmer series is going to be studied. Equipment • Spectrometer. • Diffraction grating (300 lines/mm). • mercury and hydrogen discharge tubes. • power supply . • piece of black cloth. Procedure Adjustments 1. Align the telescope with the collimator. 2. Assemble the diffraction grating in the holder. 3. Let the grating be at right angle to the collimator-telescope axis. 4. Place the mercury tube in the discharge socket, and put it in front of the collimator. 5. Cover the area between the collimator and the telescope with the black cloth. 6. Turn on the power to the discharge unit. 7. While looking through telescope, move the light source right and left till you see a clear colored line. 8. Adjust the slit screw to narrow the line seen. 9. Rotate the telescope lens to adjust the plus sign. 10. Try to center the colored lined. 11. Record the value of the scale as your zero value (θzero). Determination of d value 1. Rotate the telescope till you see the first appearance of the green line. 2. Read the angle value, θ’, and record in Table I. 3. Calculate the angle θ, corresponding to this line, and record in the table. 4. Given the wavelength of the green line of mercury λHgG = 5.46×10⁻⁷ m, determine d. 23 5. Calculate d using the value written on the grating, and compare. Hydrogen spectrum 1. Replace the mercury with the H2 tube. (use the cloth in holding, while power is off). 2. Measure the angles corresponding to the colors of the 1st order. Record in Table II. 3. Calculate the absolute angle values, and record in the table. 4. Calculate λ corresponding to each color line, and record in the table. 5. Using nf, and nI values given in the table, Calculate Plank’s constant, h. 6. Repeat steps 2-5 for the 2nd order. Record in Table III. 7. Calculate the average value for h for Tables II & III, then compare with the typical value. Table I (θzero= ) θ; ‘ λHgG (m) θ d (m) dTheoritical (m) 5.46×10⁻⁷ Table II (1st order colors) Color nf ni Faint V. 2 6 Violet 2 5 Green 2 4 Red 2 3 θ; ‘ θ λ (m) h (J.s) θ; ‘ θ λ (m) h (J.s) Avg. h= Table III (2nd order colors) Color nf ni Faint V. 2 6 Violet 2 5 Green 2 4 Red 2 3 Avg. h= 24 Questions 1. How are the Hydrogen gas atoms excited? 2. What is the purpose of the diffraction grating? 3. What determines the maximum number of the order for a specific wavelength? 4. Is it possible to draw the energy level diagram for the second orbit and above, for the Hydrogen, using your results? How? 25
