124-09_Atomic_Spectra
PHYSICS 122 Lab EXPERIMENT NO. 9
ATOMIC SPECTRA
Goal:
The purpose of this laboratory is to study energy levels of the Hydrogen atom by observing the spectrum of emitted light when Hydrogen atoms make transitions to lower lying energy levels. You use a diffraction grating to measure the wavelengths .
Equipment:
1 Optical Bench
1 Diffraction Grating
1 Ruler with light emitting diodes mounted
1 Gas Discharge Tube with Hydrogen Gas (our light source)
1 small ruler to measure the distance “y” in Fig 2. accurately (at the end)
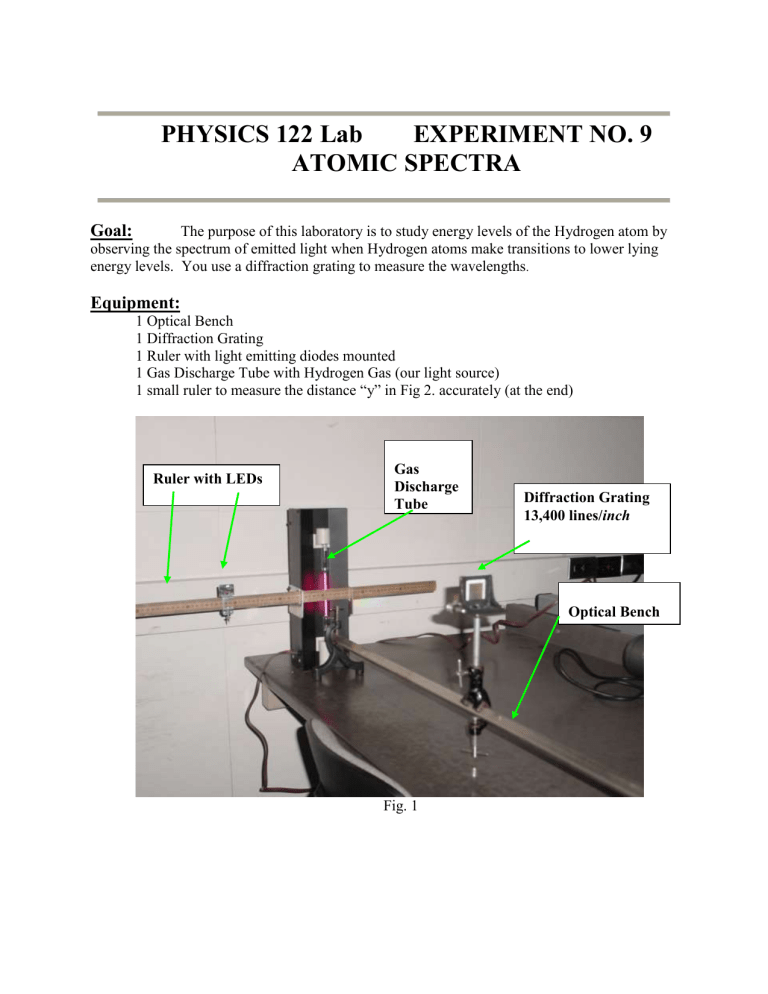
Ruler with LEDs
Gas
Discharge
Tube
Diffraction Grating
13,400 lines/inch
Optical Bench
Fig. 1
Procedure:
This is a two person process. The first person will be looking through the diffraction grating and the other person marking will be taking direction from the first person as to where to place the
LED’s, so choose the looking person to be the one with the best eyes.
First measure the distance from the spectrum tube to the diffraction grating and record it in your lab book as y. Turn on the LED’s and the hydrogen spectrum tube. The person looking through the diffraction grating will need to put their eye as near as possible to the grating and make sure to not move your eye around. Through the grating you will see three colors (red, blue-green and purple) and you should see this pattern of colors repeated out further away from the spectrum tube. Instruct your lab partner to move the LED on either side of the tube so that the light on the LED is in the center of the red band closest to the tube. Record the distance between the two LED’s in your lab book as the first order (m = 1) x for red. Now, do the same thing, but go out to the red lines that are the next furthest from the tube. This is your second order measurement (m = 2).
Now, repeat this process for the blue-green and then for the purple lines.
The geometry of the setup to measure the angles pointing to a specific part of the spectrum is illustrated in the figure below.
Fig. 2
To find the wavelength of the colors, you need a couple of formulas. First m λ = d sin(θ) and second tan(
)
x
2 y
. To calculate d you need to know that the diffraction grating has 13,400 lines/inch (that is all that you need to know to calculate d, your TA will not give you any more help). Using the x and y that you recorded above calculate θ and then use that to calculate λ making sure that you keep the x’s and then m’s correctly paired. You should get 2 values of λ
max
min for each wavelength; use the average as the value of the wavelength and for the
2 error. Theoretically the wavelengths should follow the Balmer equation:
1 n
R
H
1
2
2
1 n
2
, n = 3, 4, 5, …
Where R
H
is the Rydberg constant which is known to be 1.097 x 10
7
m
-1
.
By trial and error find which n is associated with each color. This can be done without using the known Rydberg value by taking the ratio of two wavelengths, so
n
n
1
1
4
n
2
1
n
4
1
2
. Using this formula, plug in the wavelengths that you have calculated and plug in different numbers for n. So, for example, if you have the purple wavelength as λ n
and red and λ n+1
and the left and right side of the equation are equal (it won’t be exact, but should be really close) for n = 7, then that would mean that purple is n = 7 and red is n = 8 (this is not what it really is, so don’t think that you should get this number, start with n = 3 and try different ratios).
Once you find the n’s that match with the wavelengths, graph 1/ λ n
vs. 1/n
2
with errors in
1/ λ n
. Fit this graph with a line and find the slope, which should be the R
H
.
Write-Up:
Your report should include
1) The values of x (there should be a total of 6) and the y value shown in Fig 2.
2) What n value corresponds to what color
3) Graph of 1/ λ n
vs. 1/n 2 with errors in 1/ λ n
4) Value of R
H
with errors and if it is in agreement with the accepted value
